The Kodachi dashboard, control by control
Five dashboards and a boot tool, one manual. Each page plays through the real interface and explains every control a user touches, or you click the control you are looking at and read about that one. Where two controls look alike and are not, a Know this card opens under the explanation and compares them: WireGuard against Hysteria2, plain WireGuard against its obfuscated variants, round-robin against weighted, the three panic tiers, what each hardening level breaks. Nothing here runs: these are renders of the dashboard plus its own help text. New to Kodachi? Read in this order. Startup first, because every session begins there. Then Circle, the dashboard a fresh install opens, then Lite Classic for the complete workspace and Shared controls for the top bar, the output drawer and the notifications that sit on every dashboard. SOC and Vitals only watch the machine, ColonyOps is for building multi-step workflows, AutoShield runs before any dashboard opens, and the tray menu reaches the same controls from the panel icon. Two rules hold everywhere. Switching between dashboards changes only the view. And no dashboard connects a VPN or sends your traffic through Tor by itself. Out of the box, the only actions that run without a click are the startup privacy actions, while the launcher is still on screen and only with automatic sign-in on (the default). By default they give the computer a random hostname and switch DNS to DNSCrypt, once after each boot; a random MAC and a random or synced timezone also run once per boot if you switch them on, while Restore MAC, Detorrify and Prepare Tor, if switched on, run every time the dashboard starts. The switches are in Settings under Dashboard, Startup, and also in Advanced setup under Launch Settings when your plan includes Advanced setup (the support page shows live which plans do). Others act on their own only once you set them up: AutoShield, if you arm it, whose steps can include connecting a VPN or sending all traffic through Tor; and the dashboard’s own protection in Settings, Security: auto-lock, the response to failed unlock attempts (which can cut the network or power the machine off) and a scheduled Destroy.
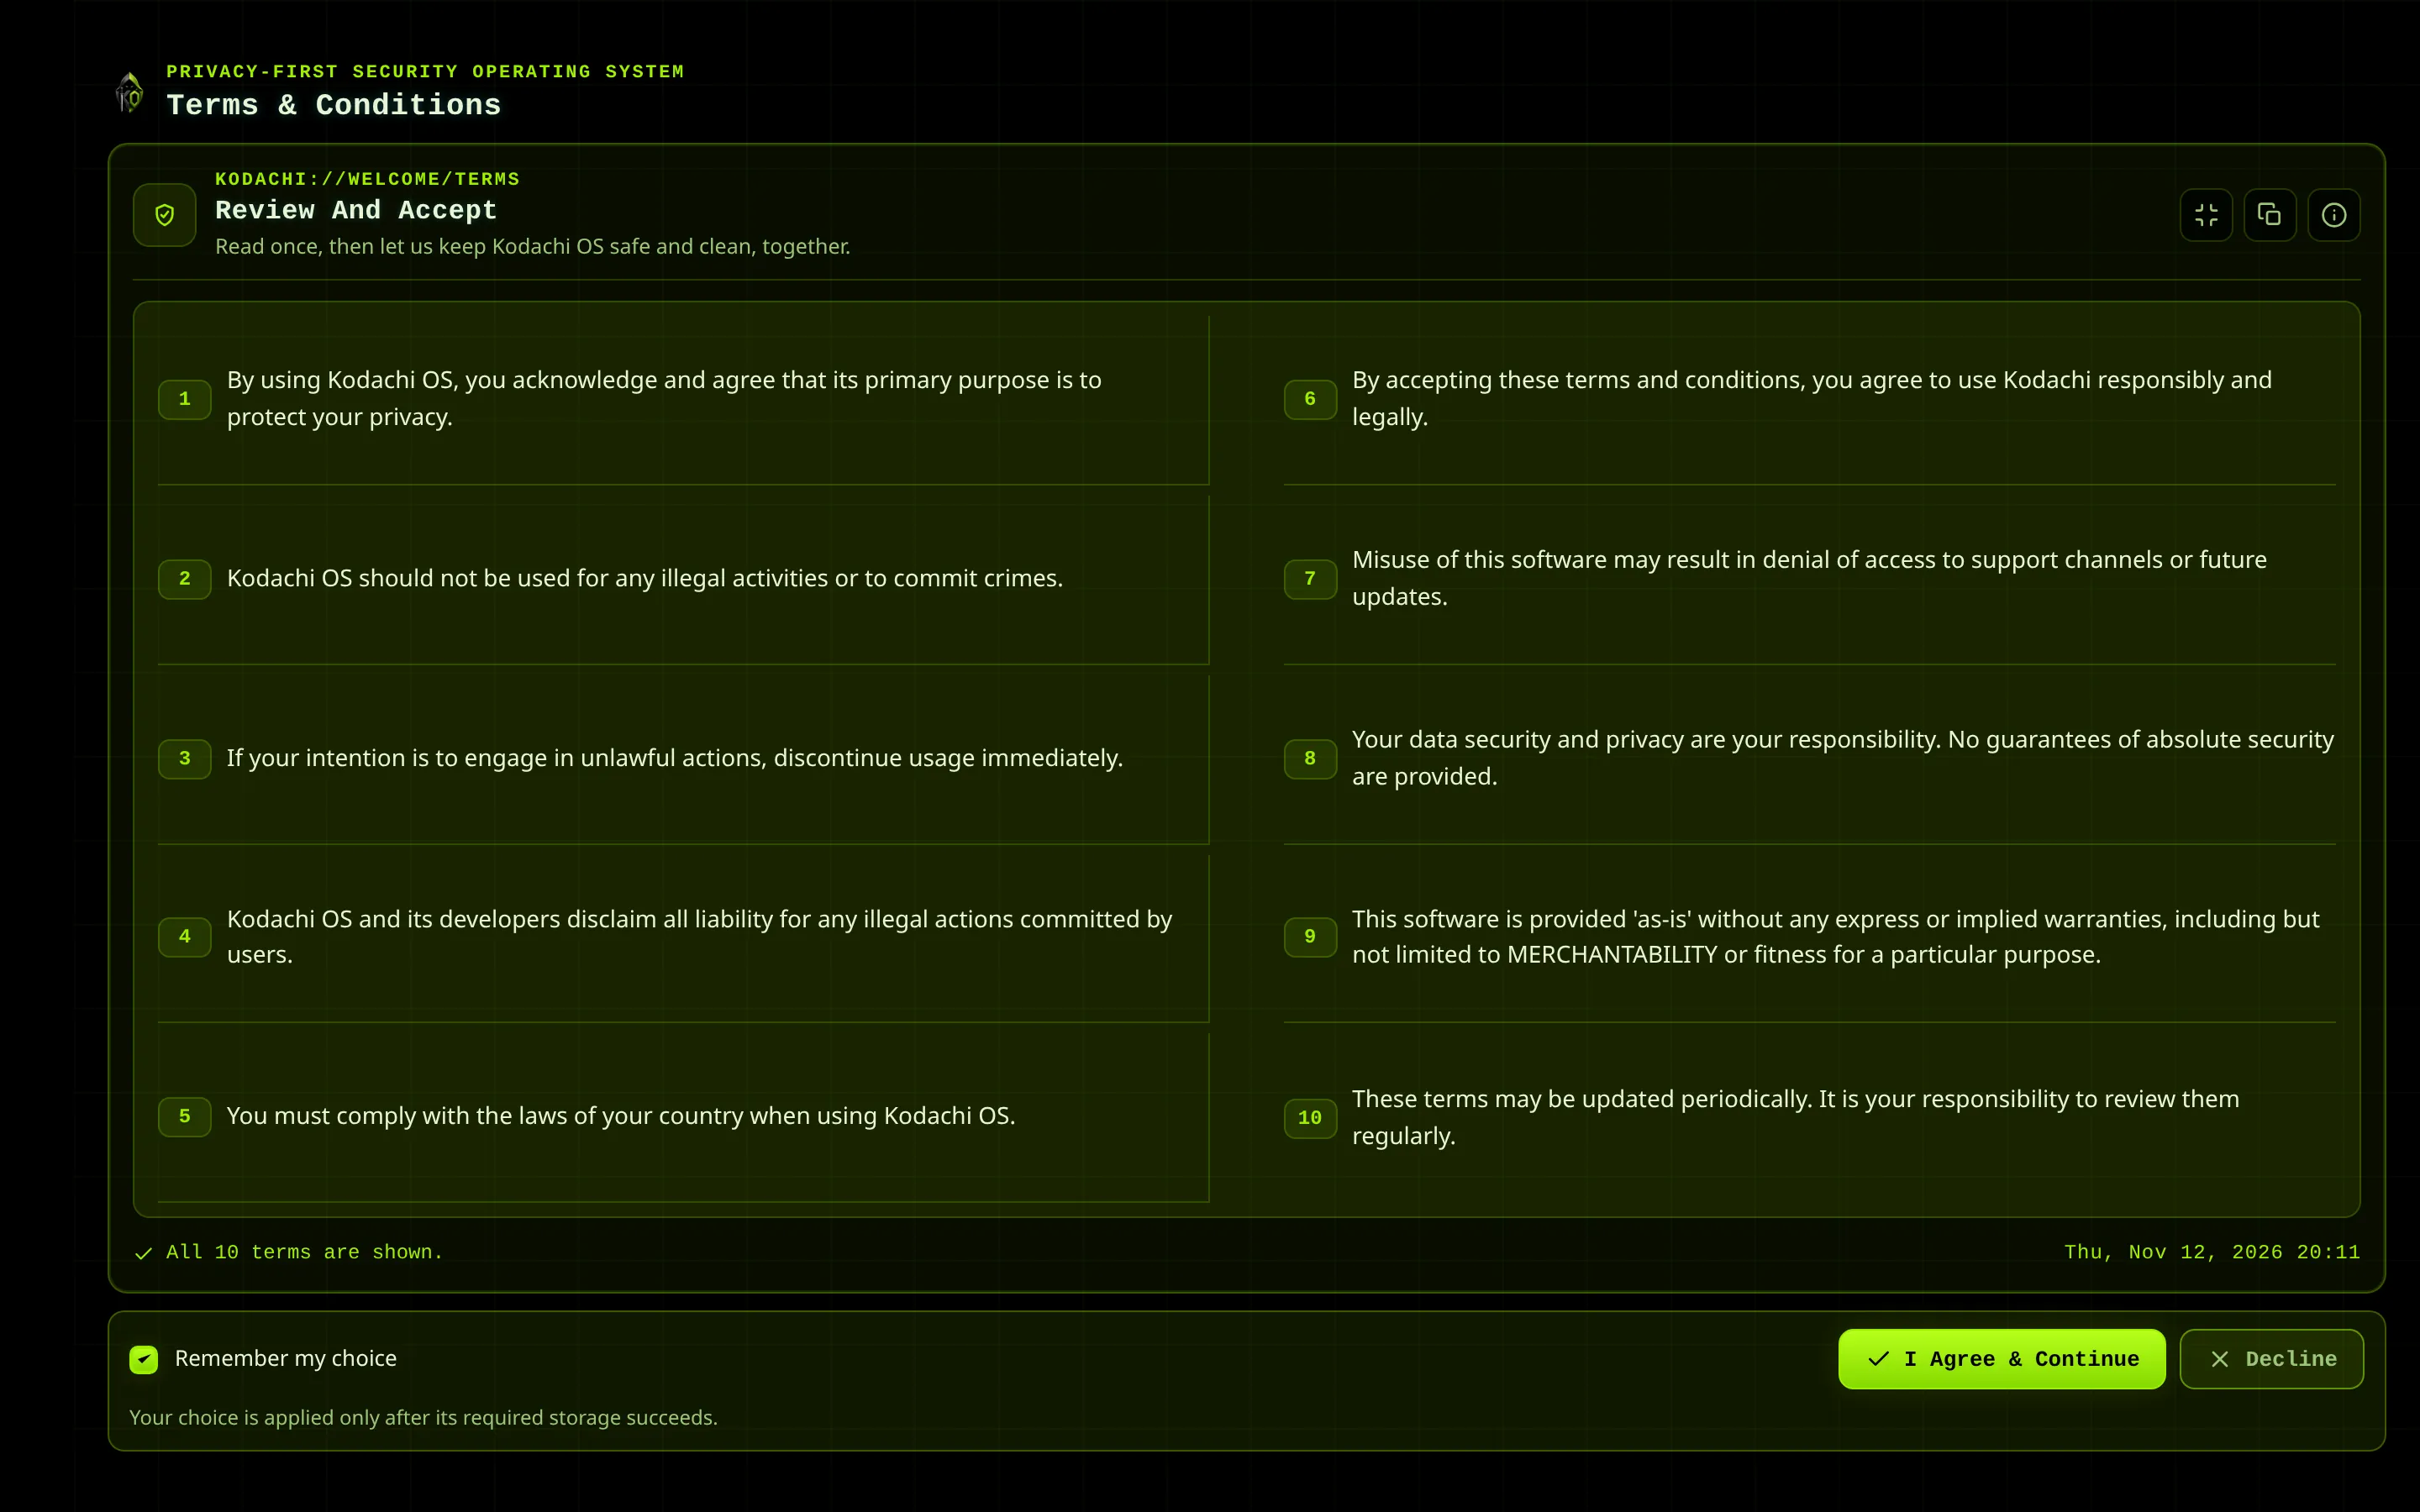
Startup screens
Terms, the Quick Launch picker, the Advanced setup screen and the loading screen: everything before a dashboard opens.
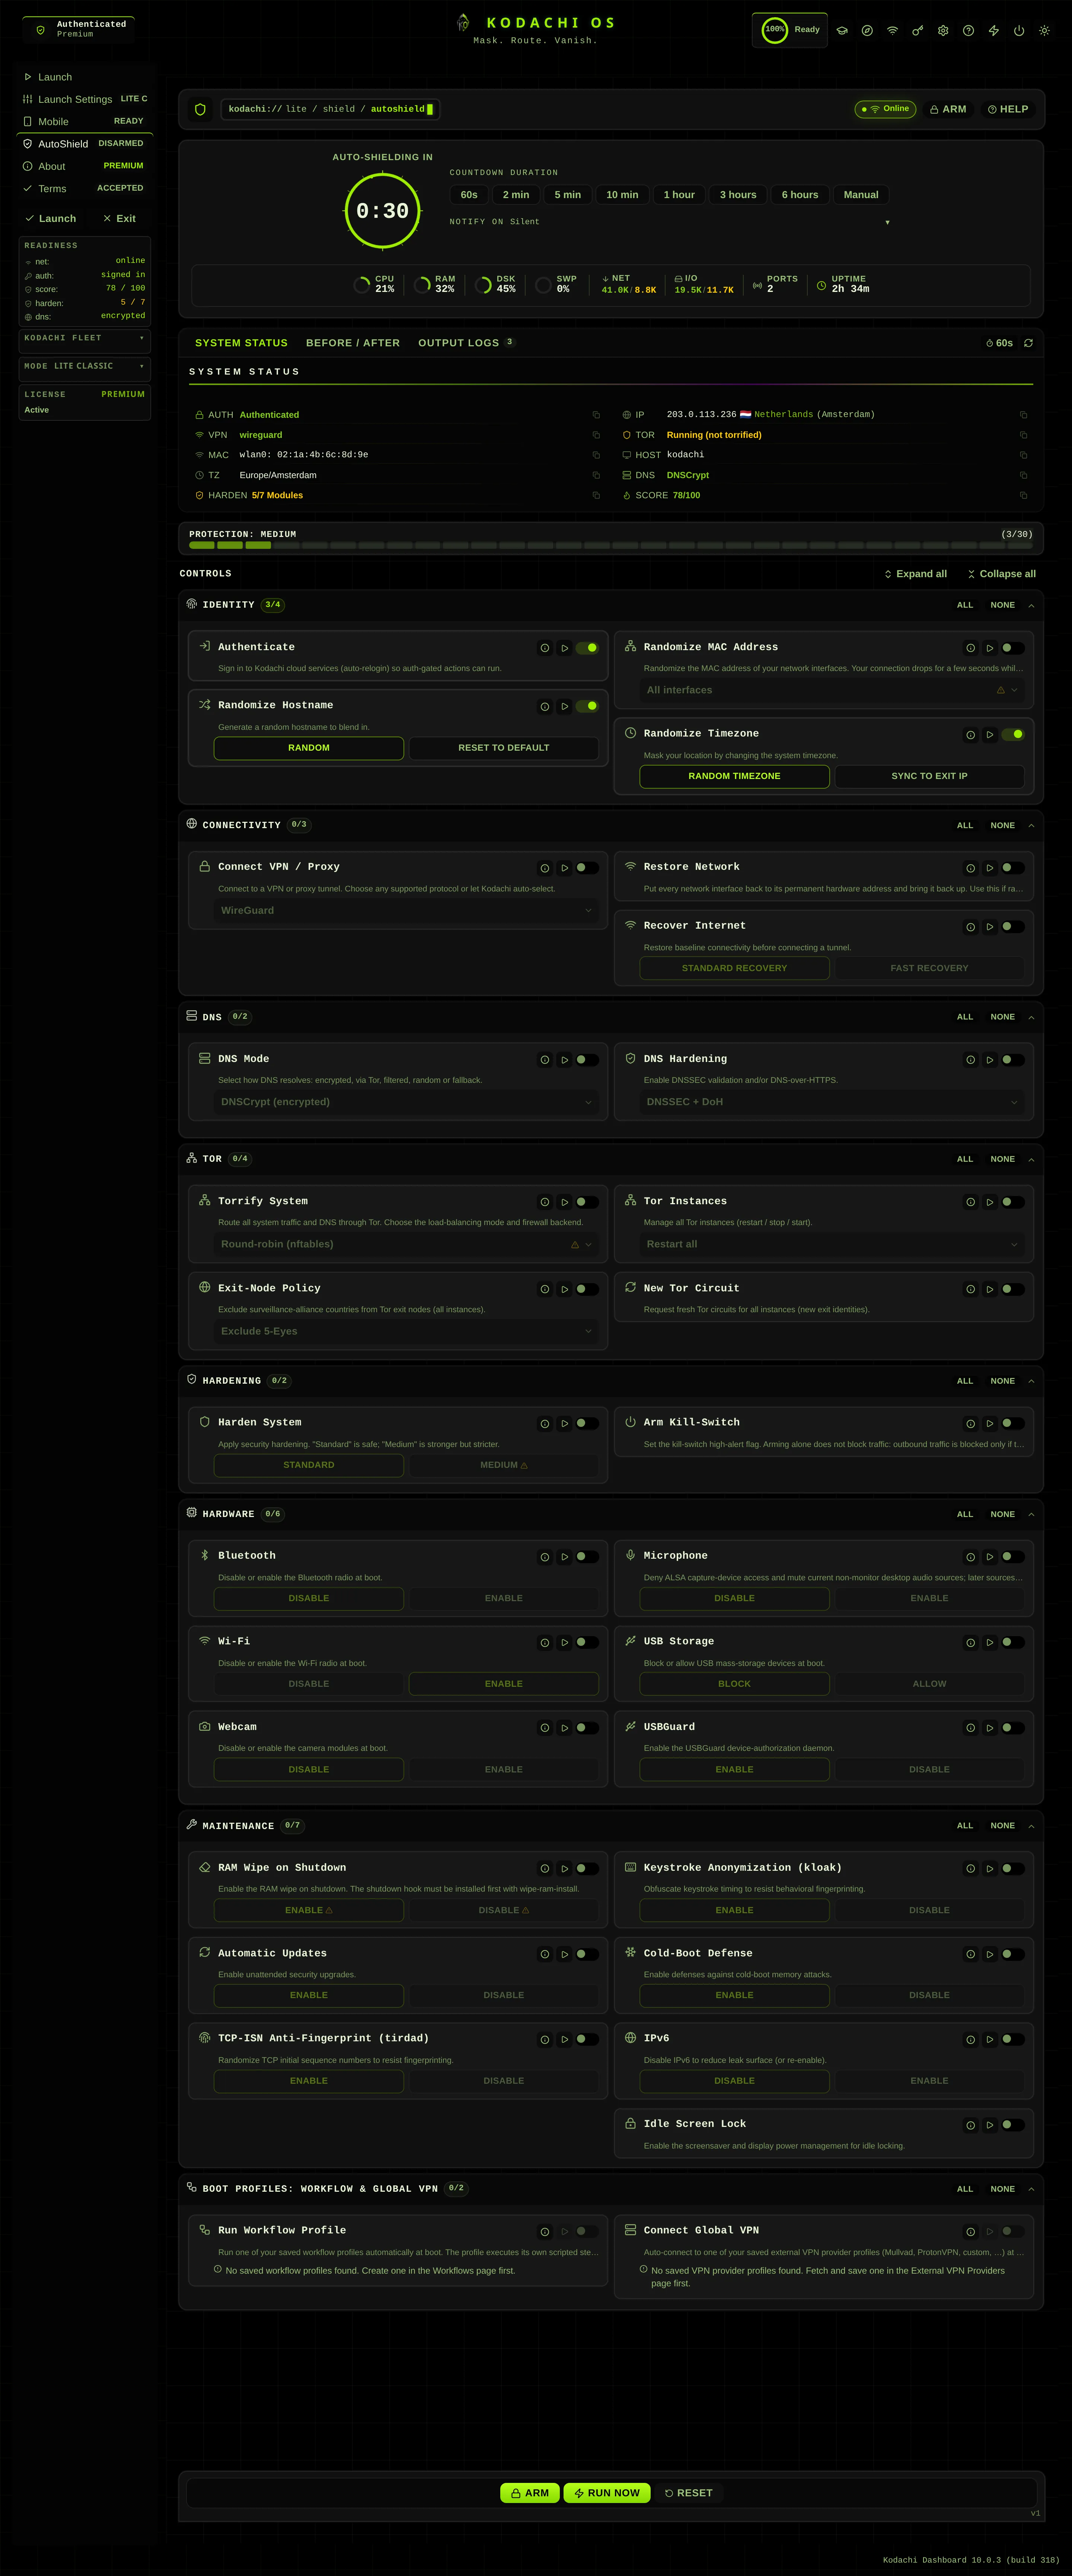
AutoShield
The boot automation system: choose what Kodachi does to protect you automatically every time it starts.
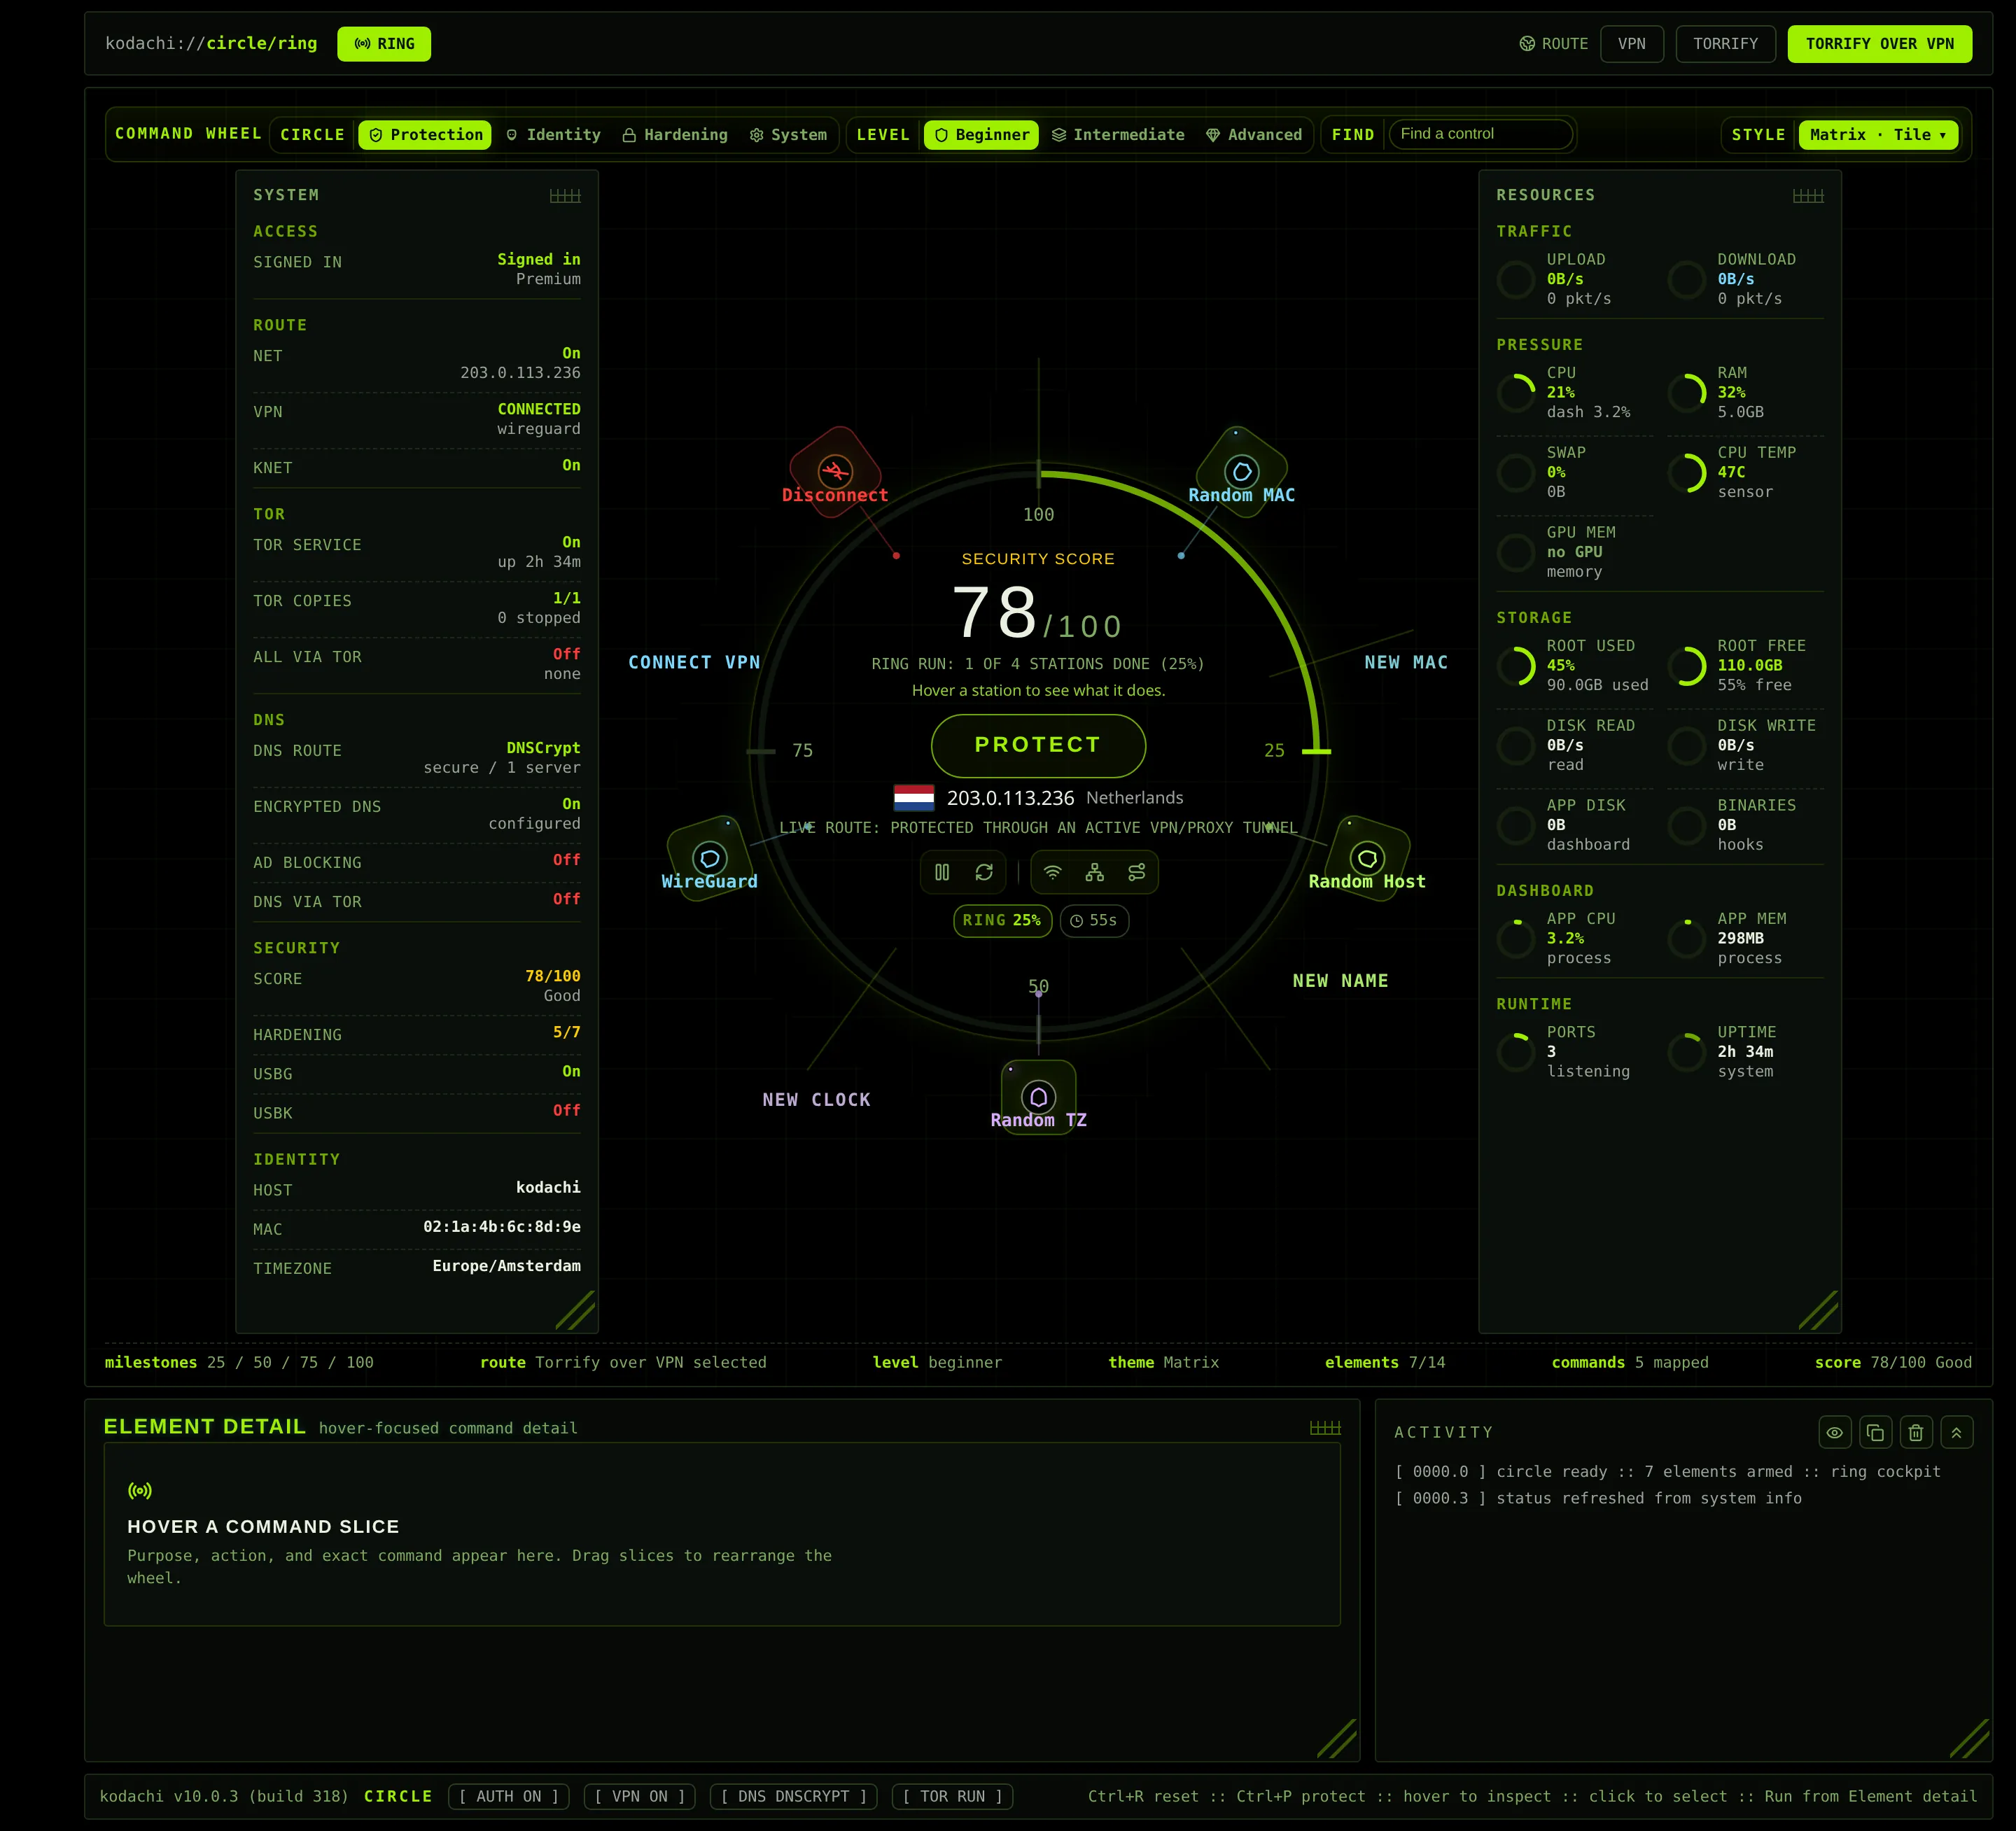
Circle
The simplest dashboard: one ring, seven protection segments, live status in the middle.
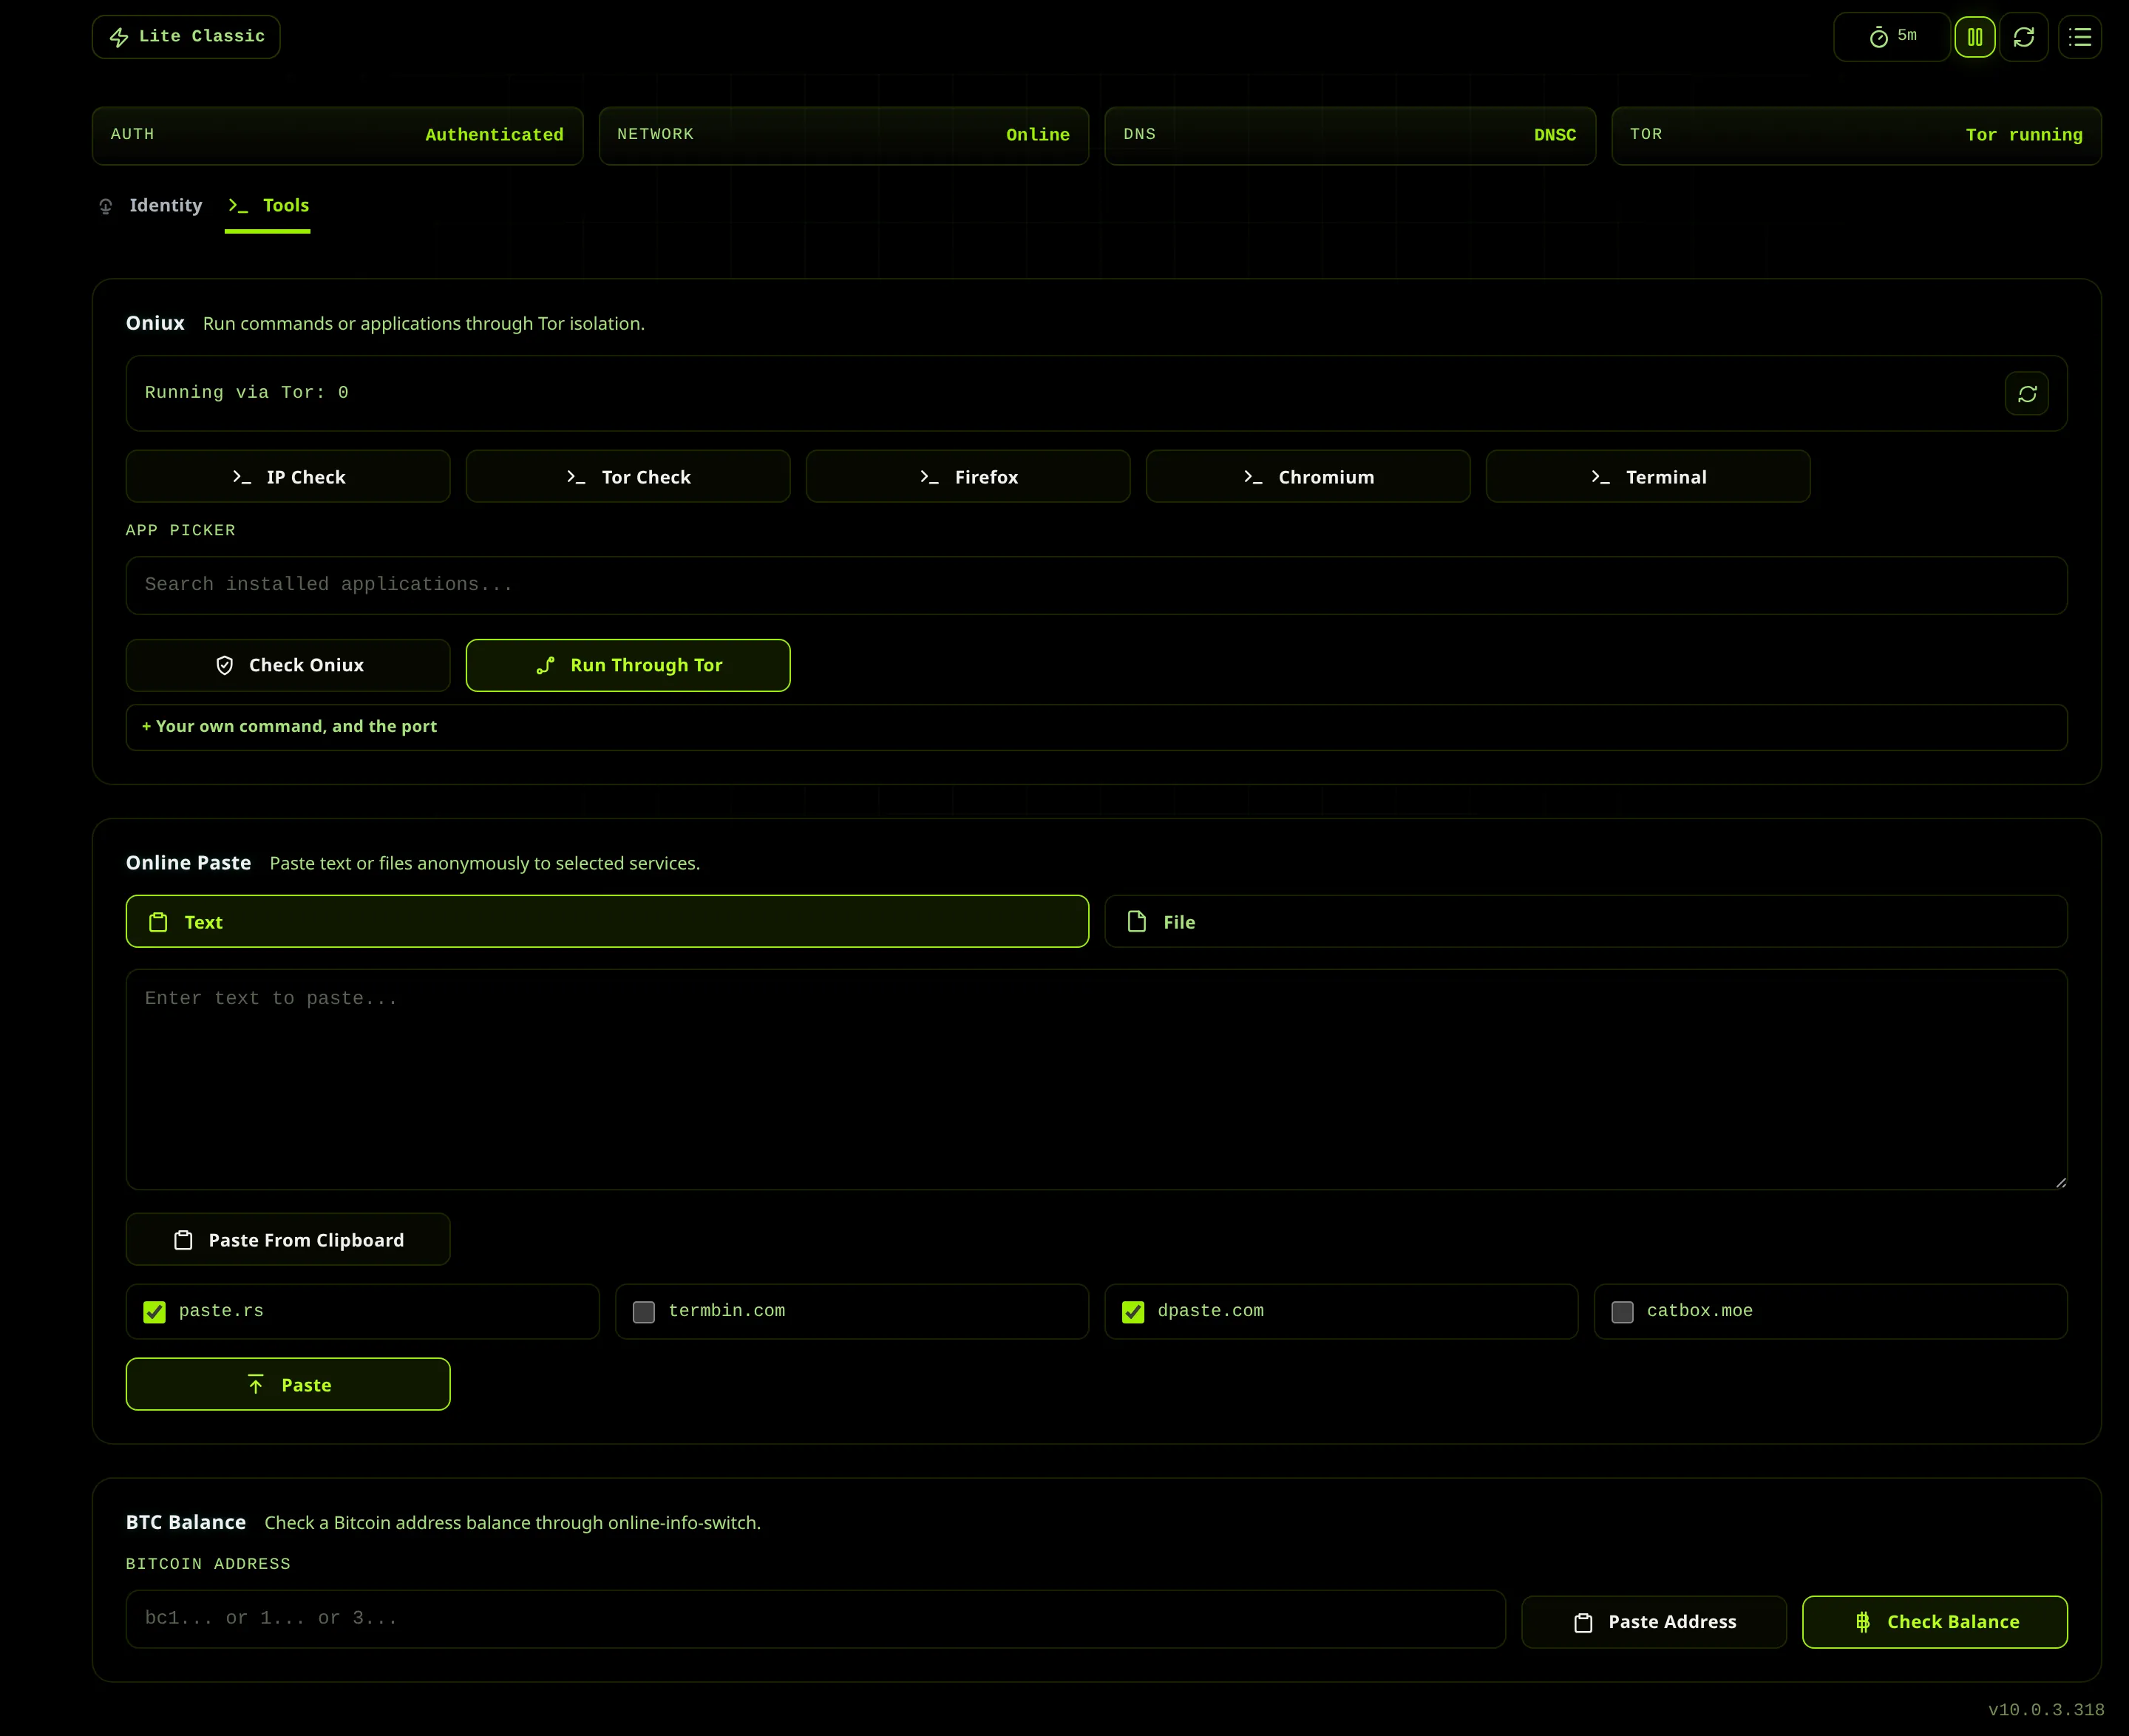
Lite Classic and its islands
The main workspace: 16 pages and their sub-tabs, covering routing, Tor, DNS, hardening, monitoring, AI, workflows and settings.
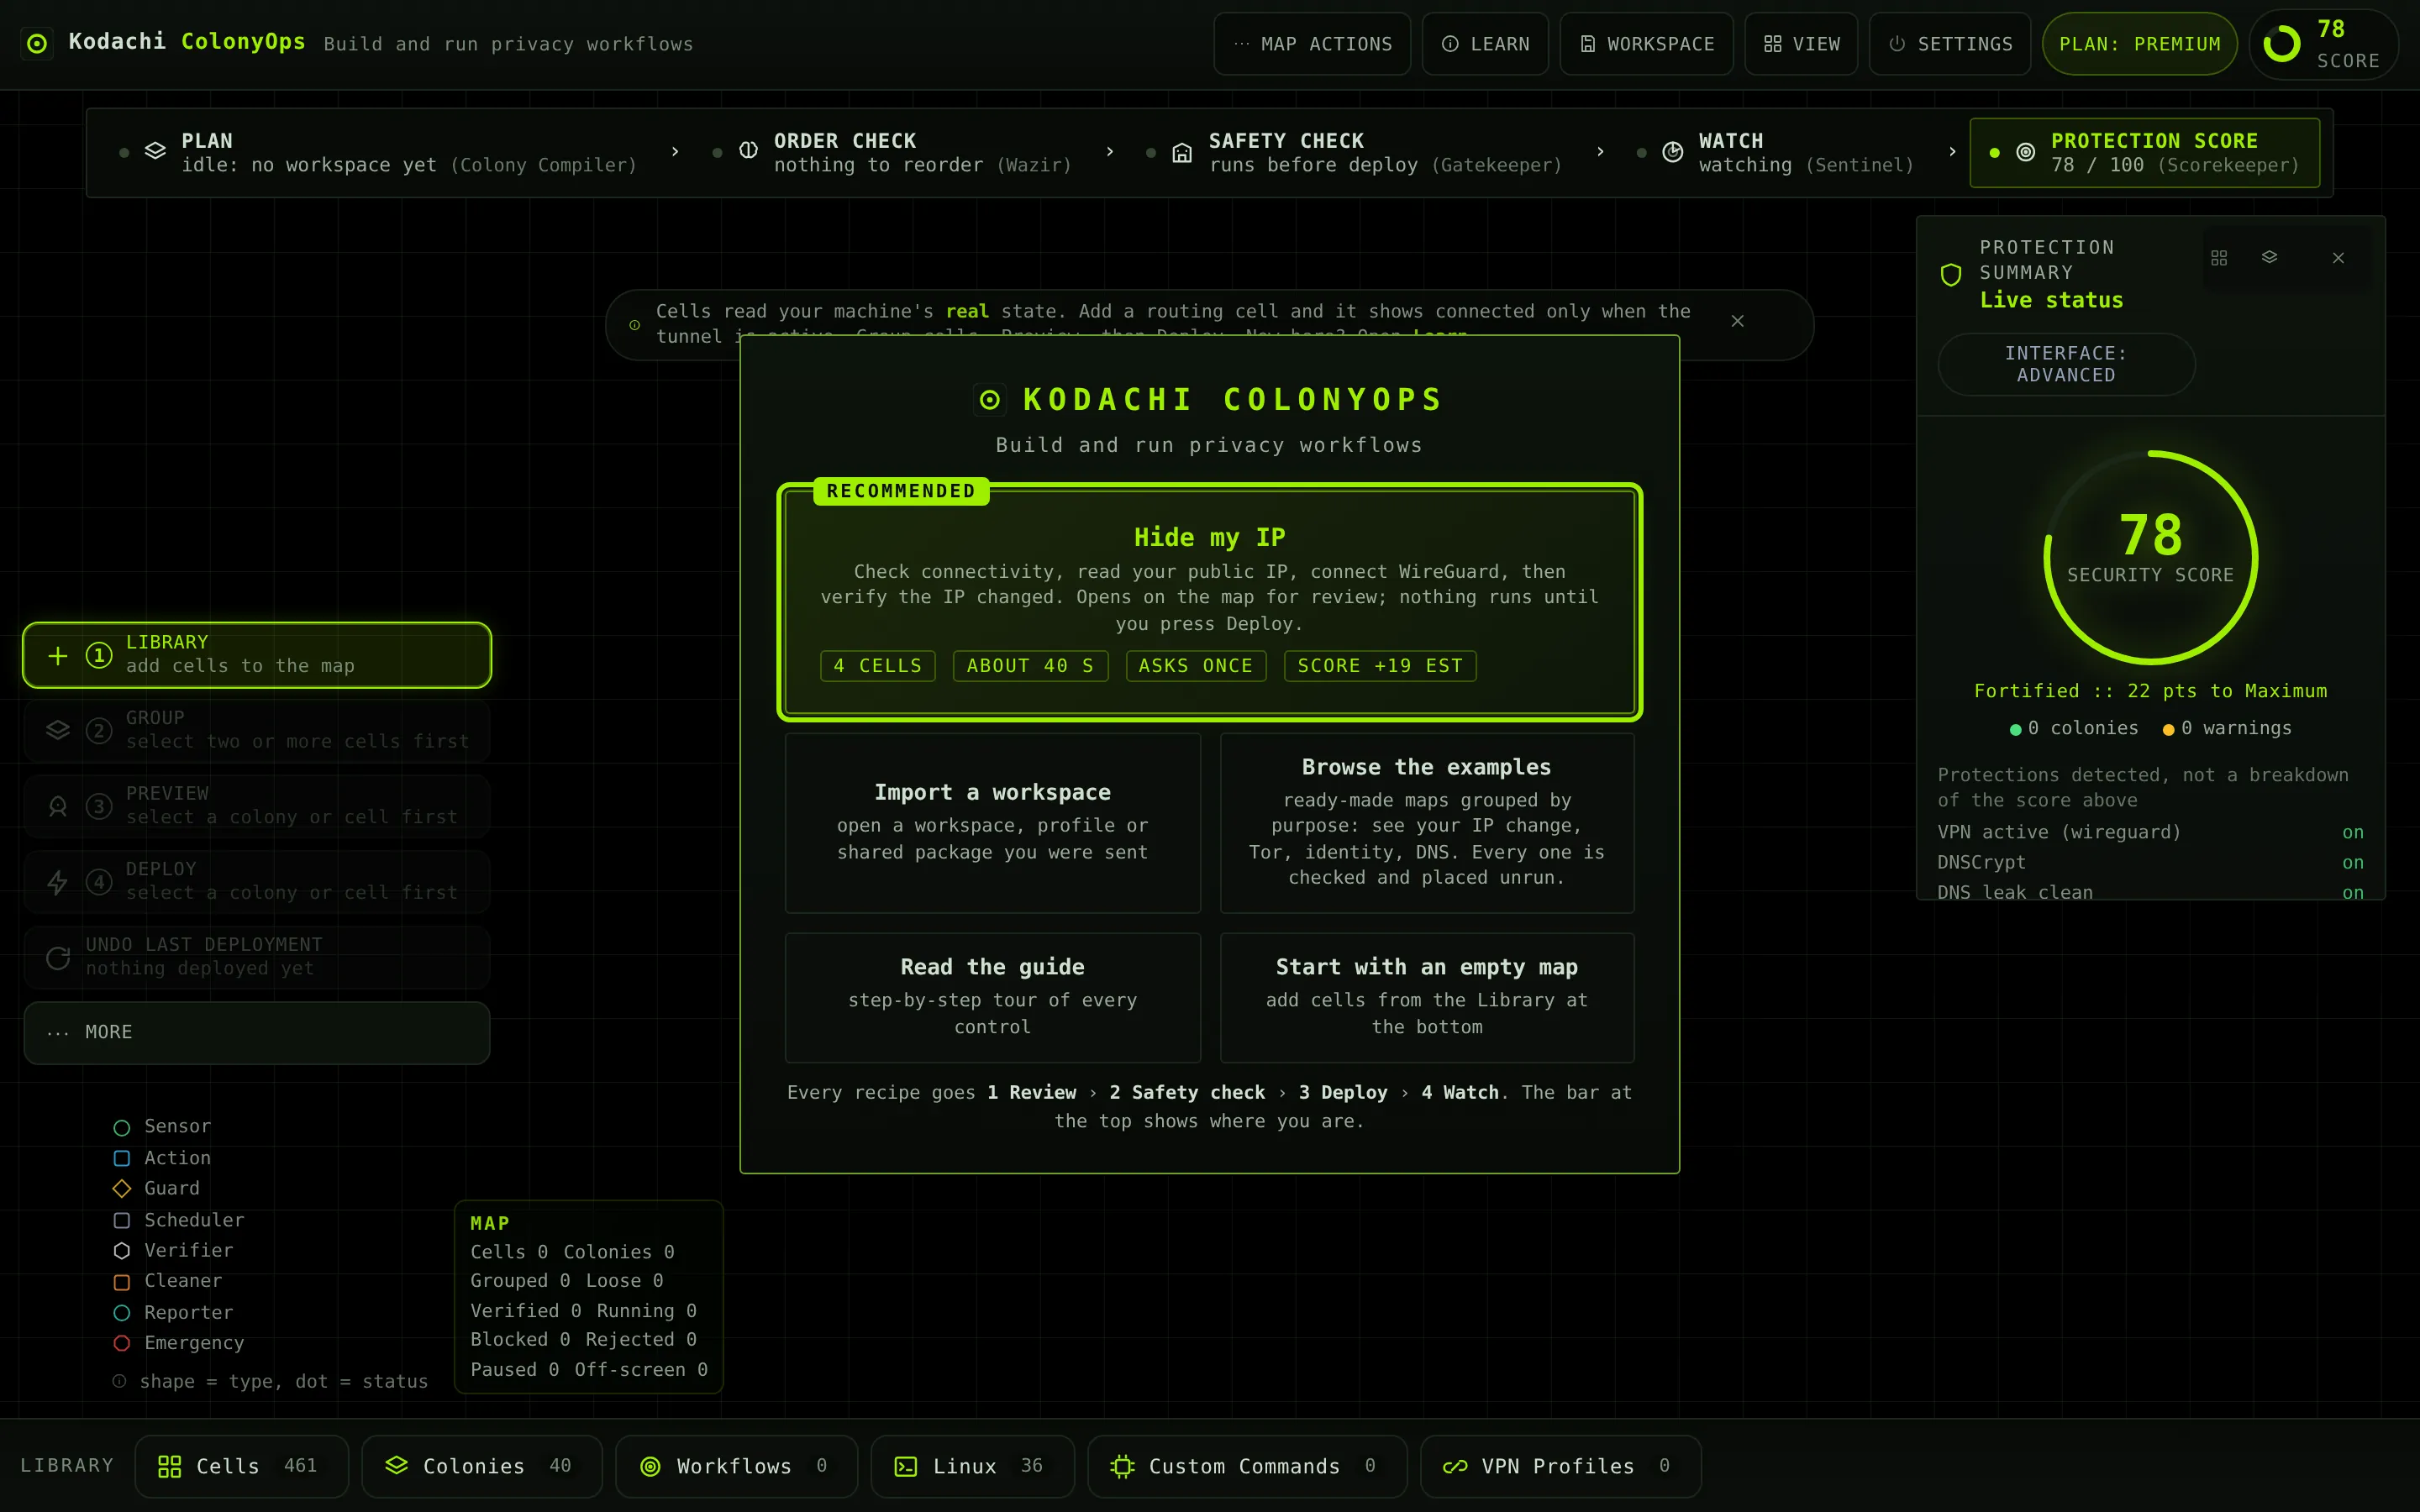
ColonyOps
The workflow operator mode: build, guard, preview and deploy multi-step privacy workflows on a visual map.
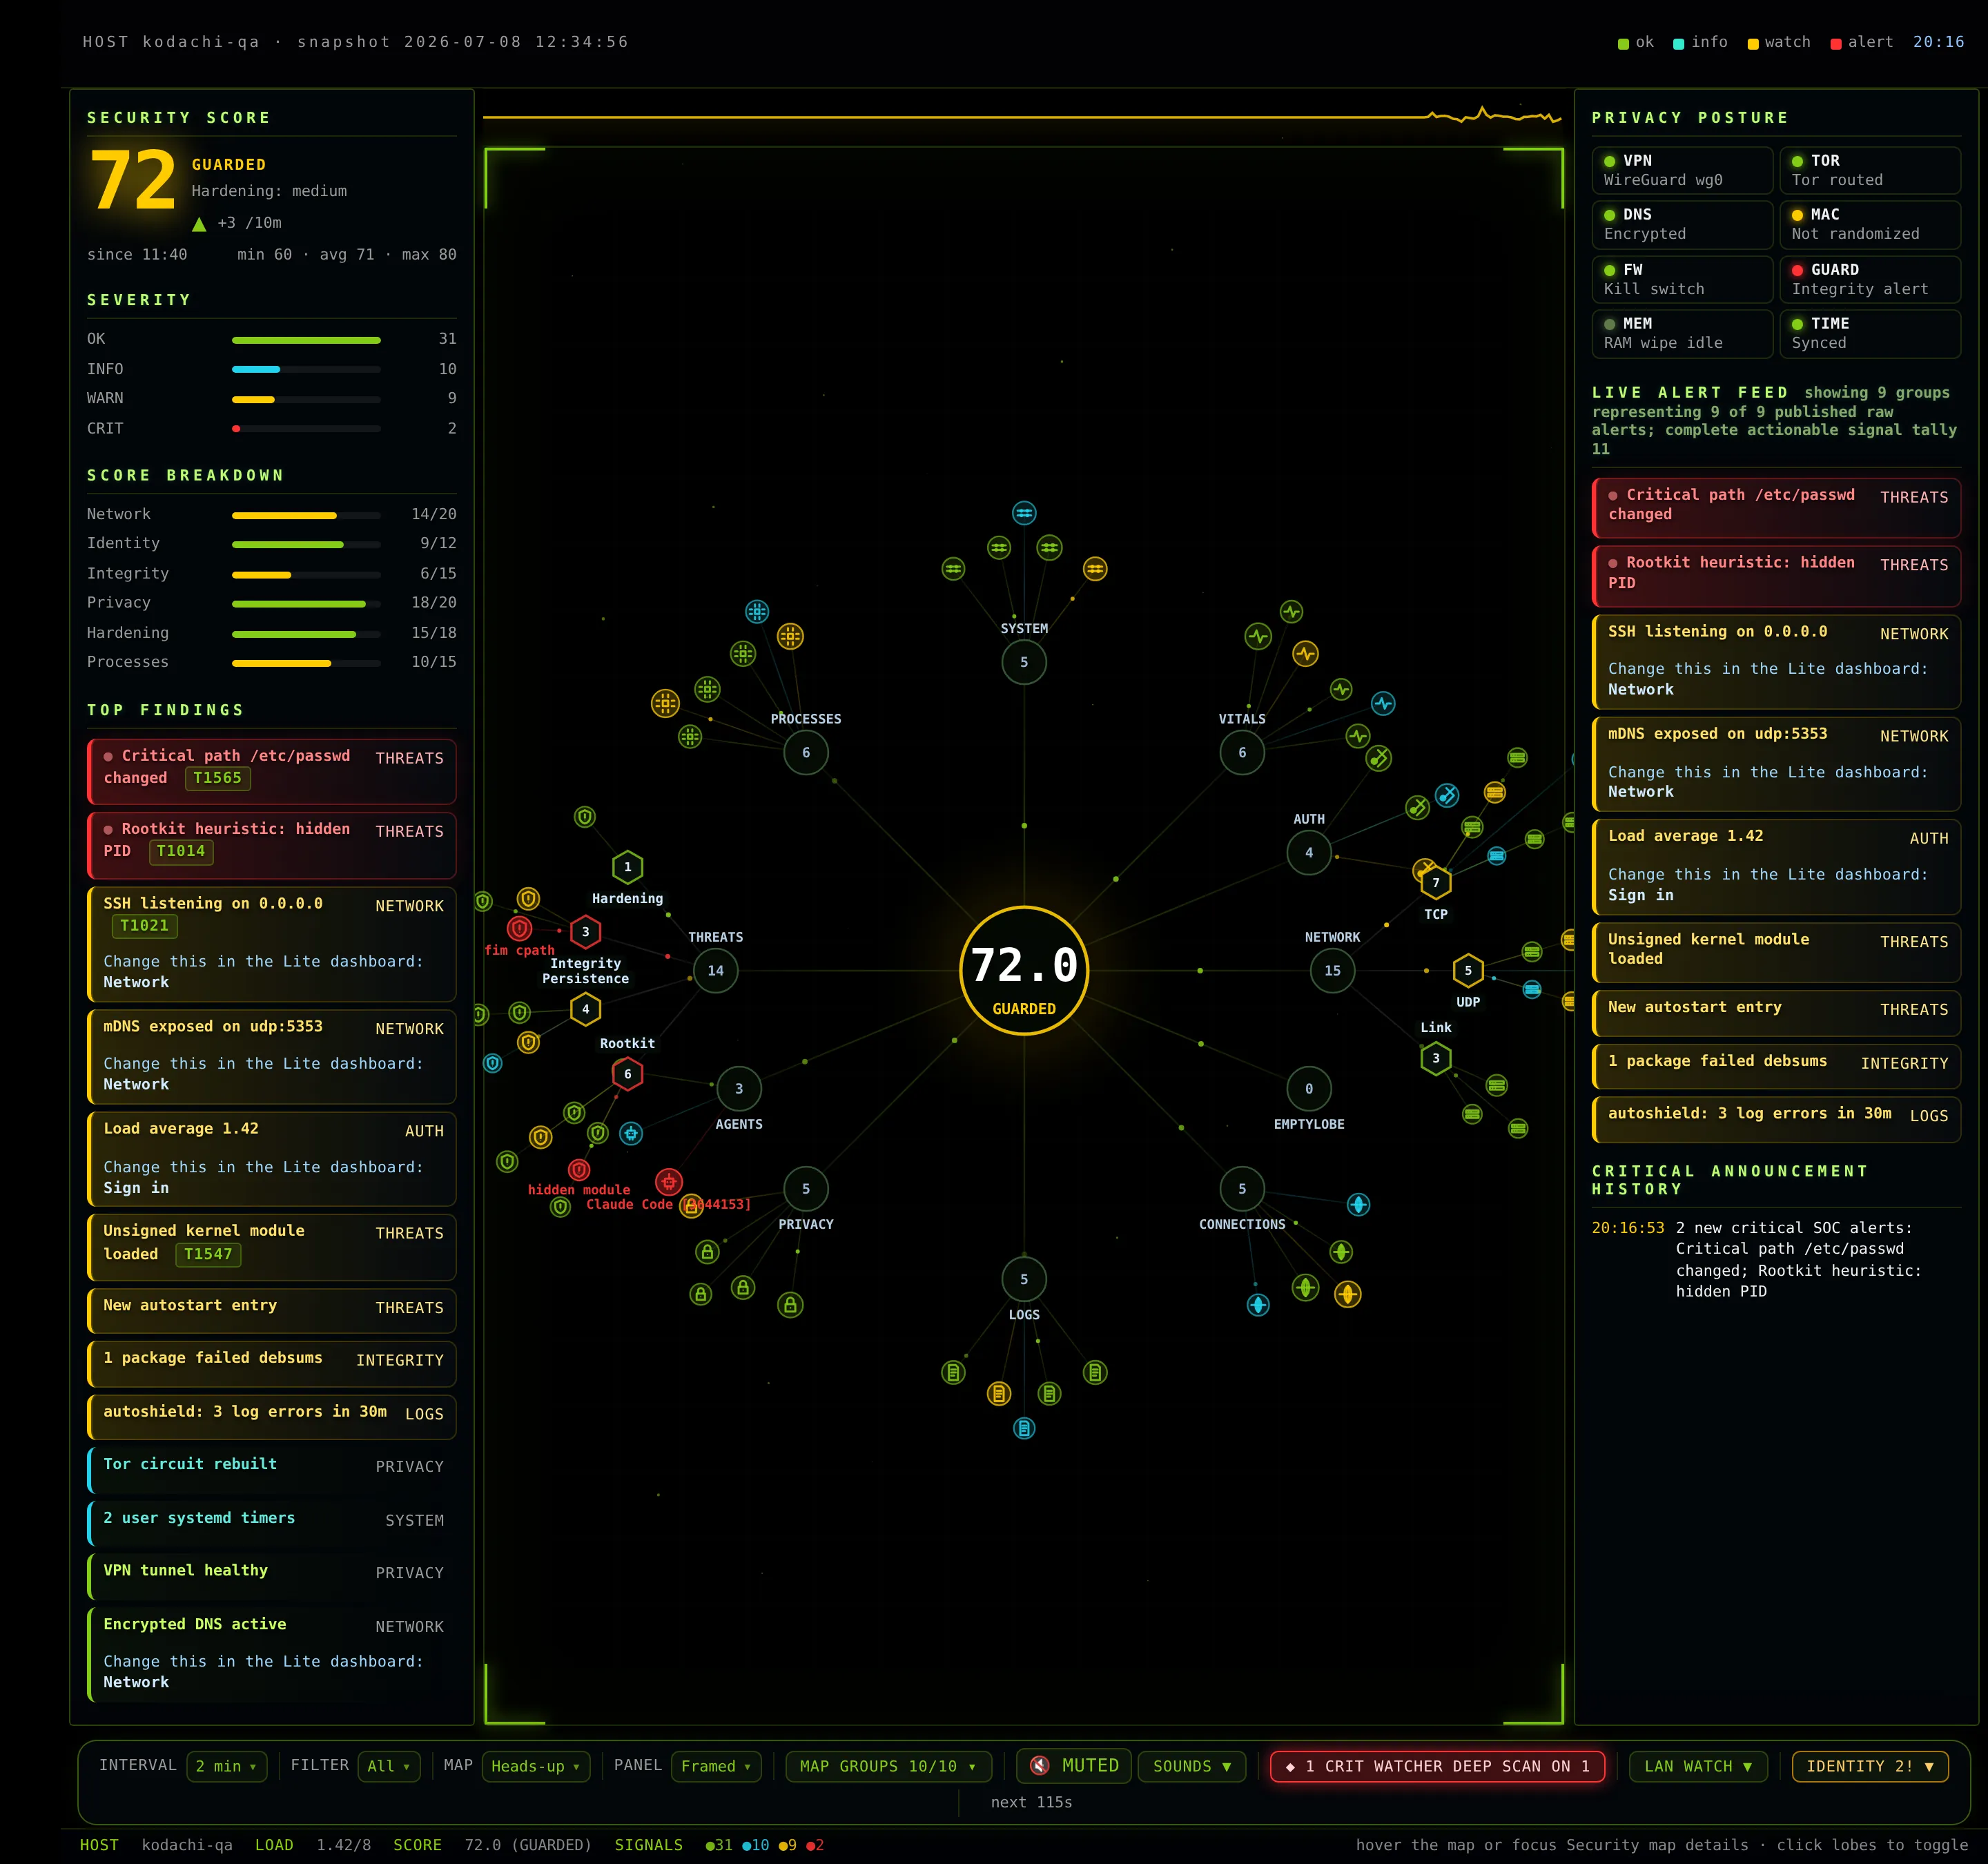
SOC monitor
The live security operations monitor: threats, exposure, the watcher, LAN watch, identity alerts and the world map.
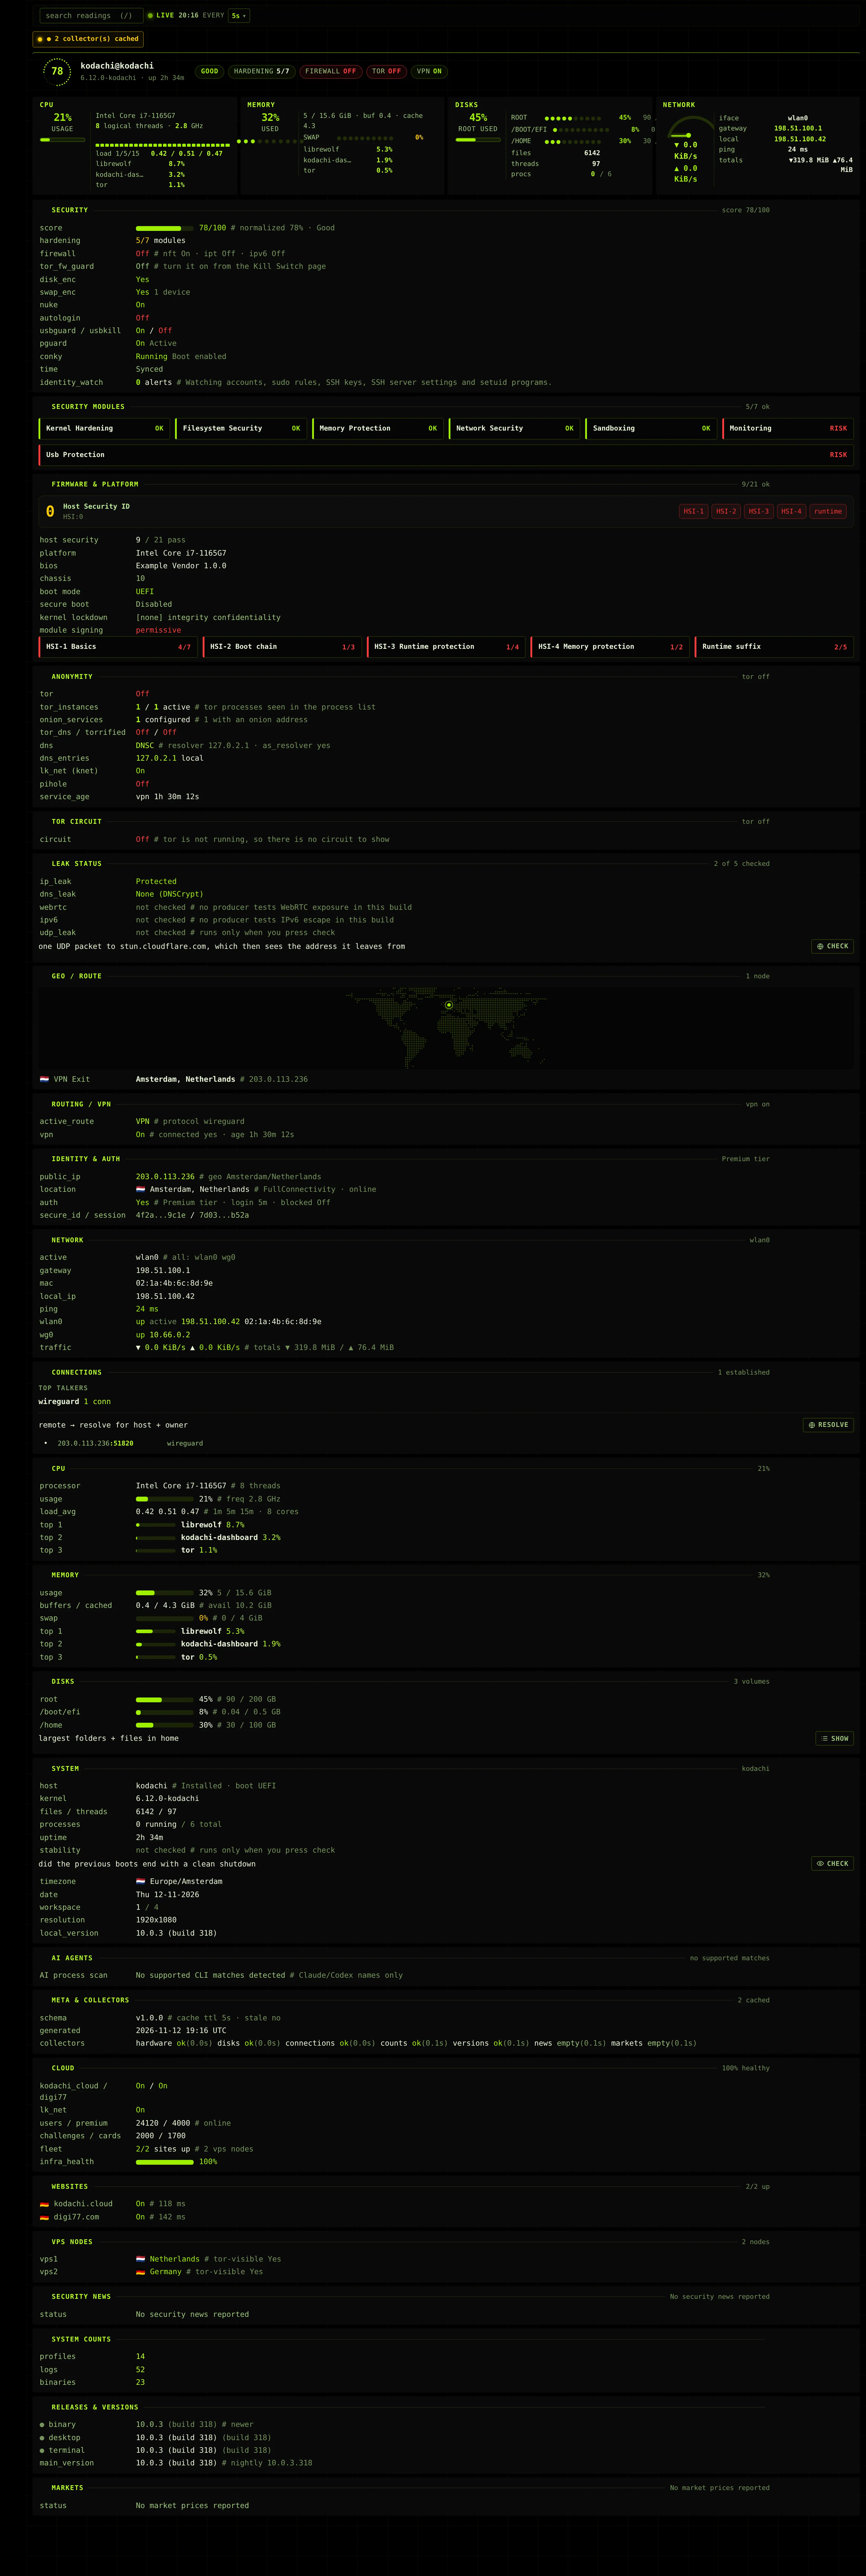
Vitals
The live system monitor: CPU, memory, disks, network, processes and the Kodachi service rollup.
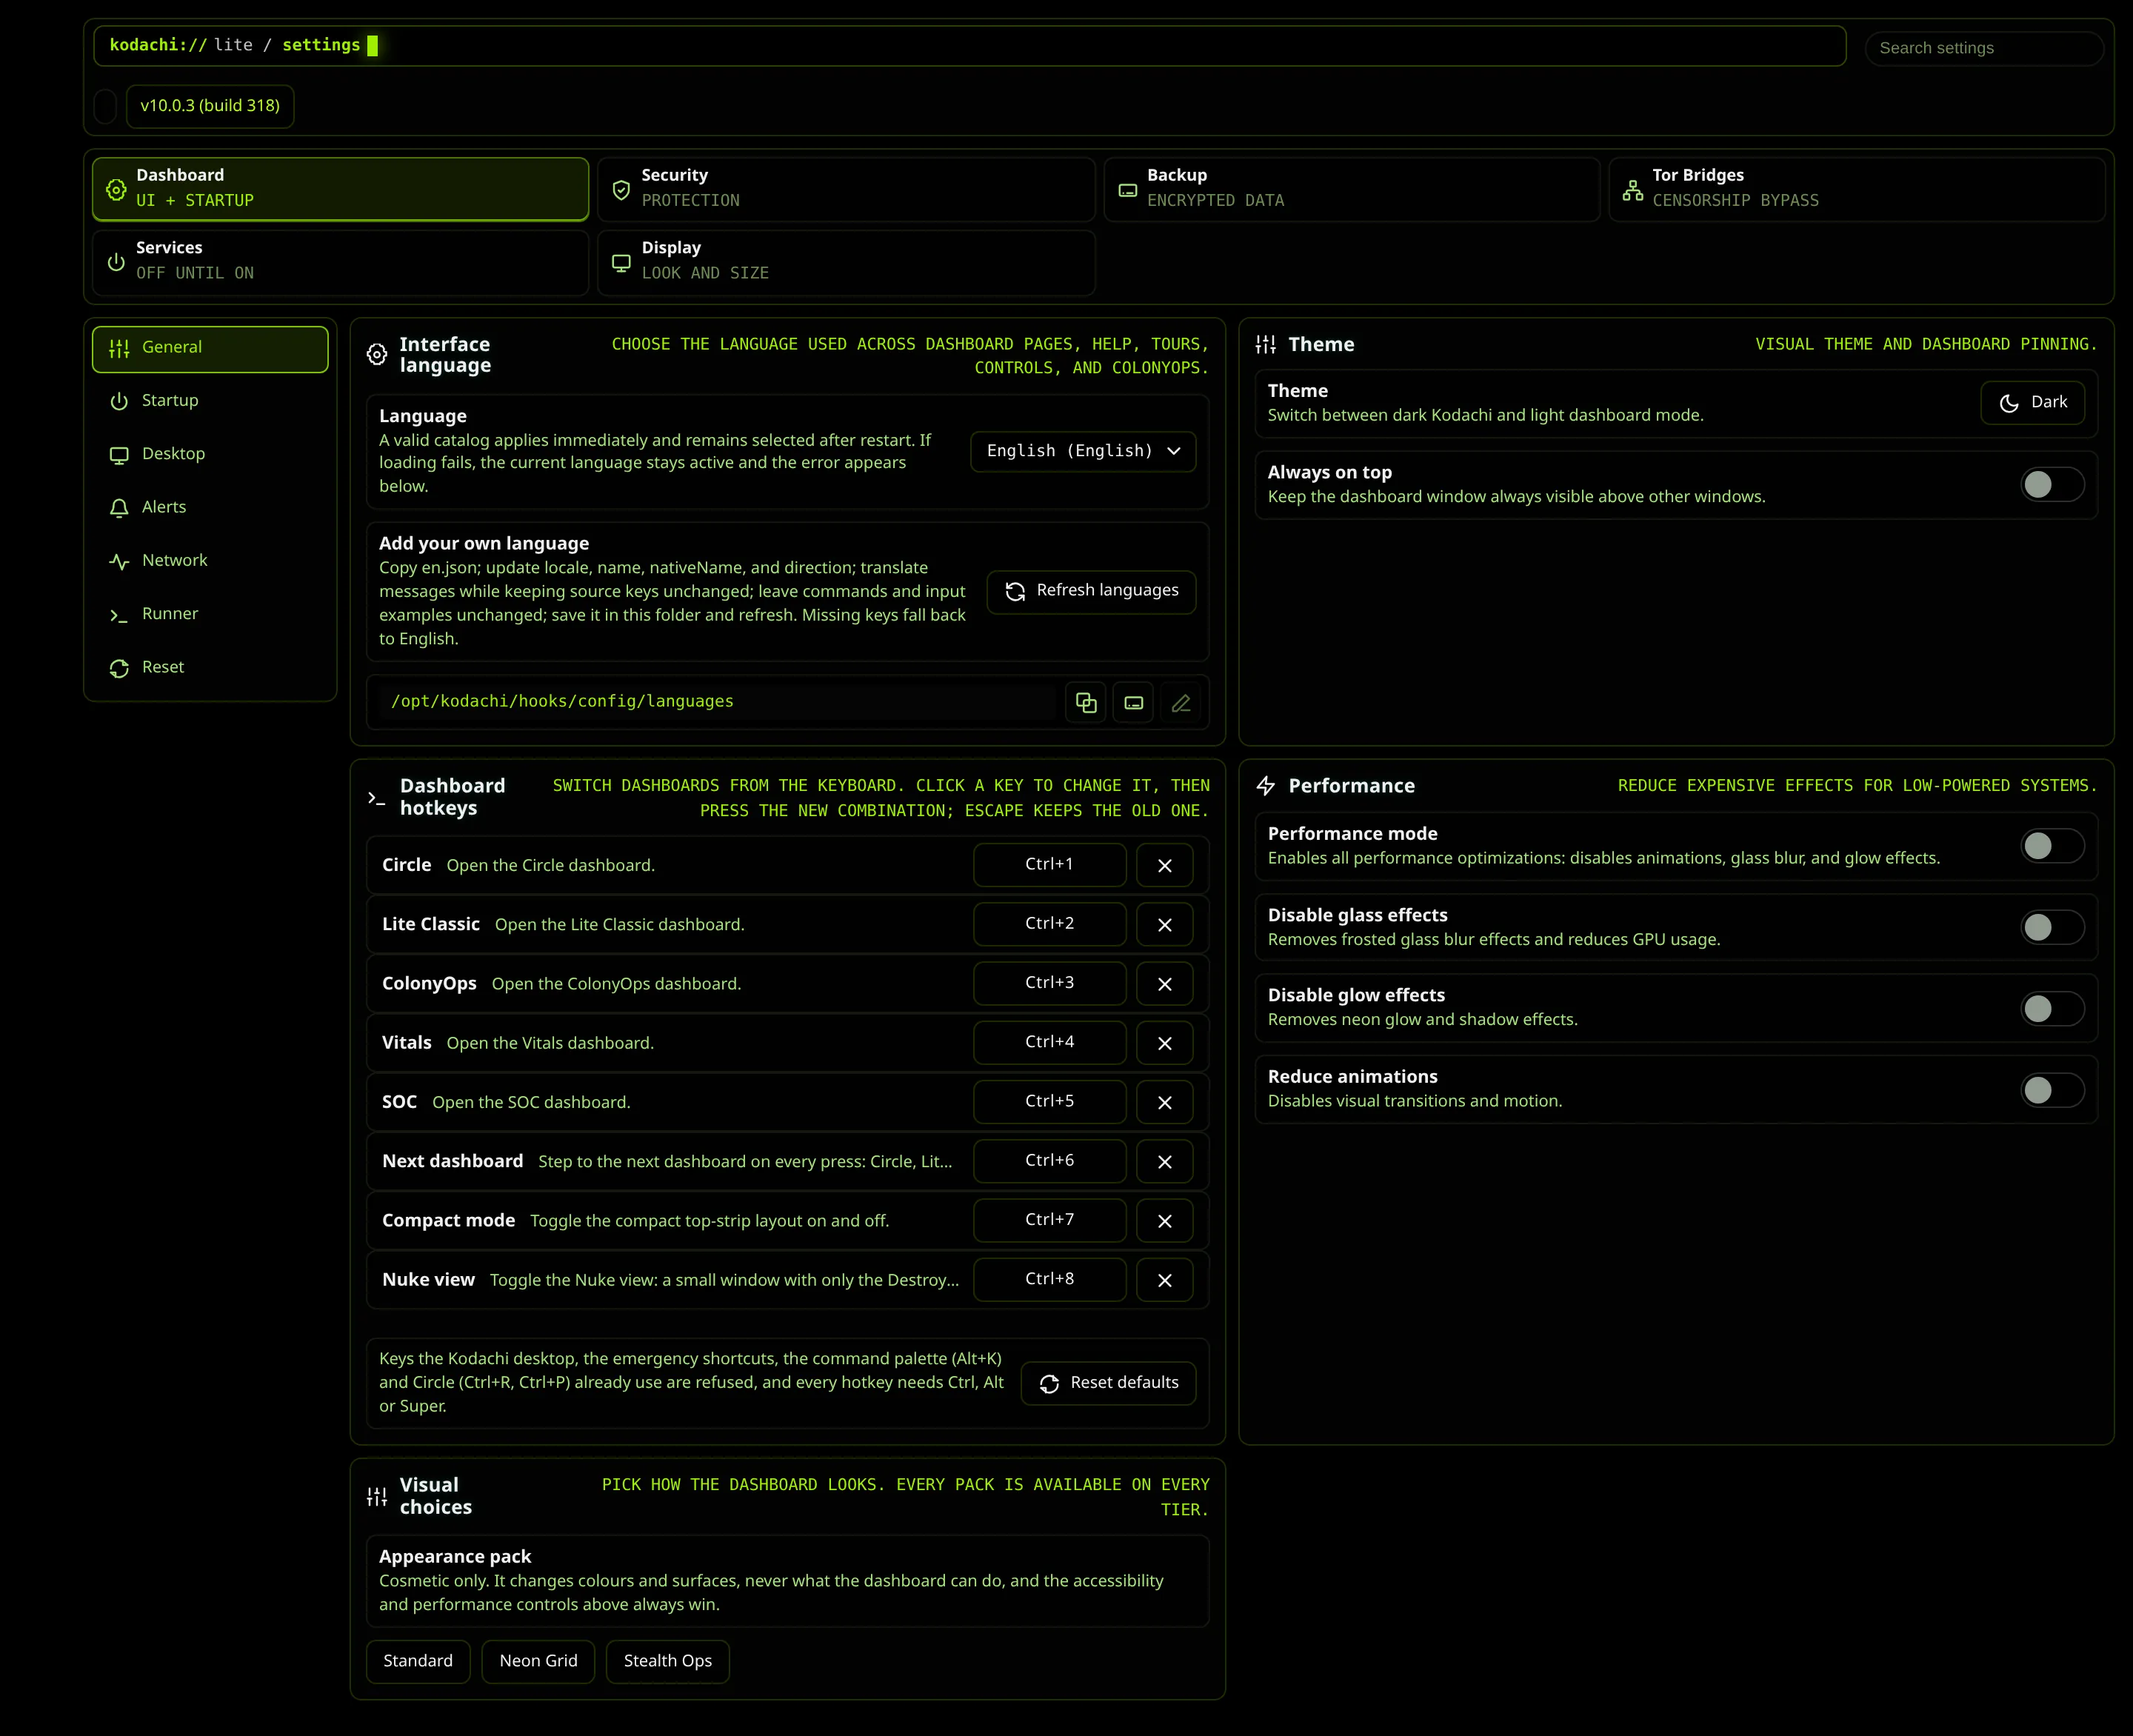
Settings
Six groups: dashboard preferences across seven tabs, dashboard protection, encrypted backup, Tor bridges, background services and how the dashboard looks.
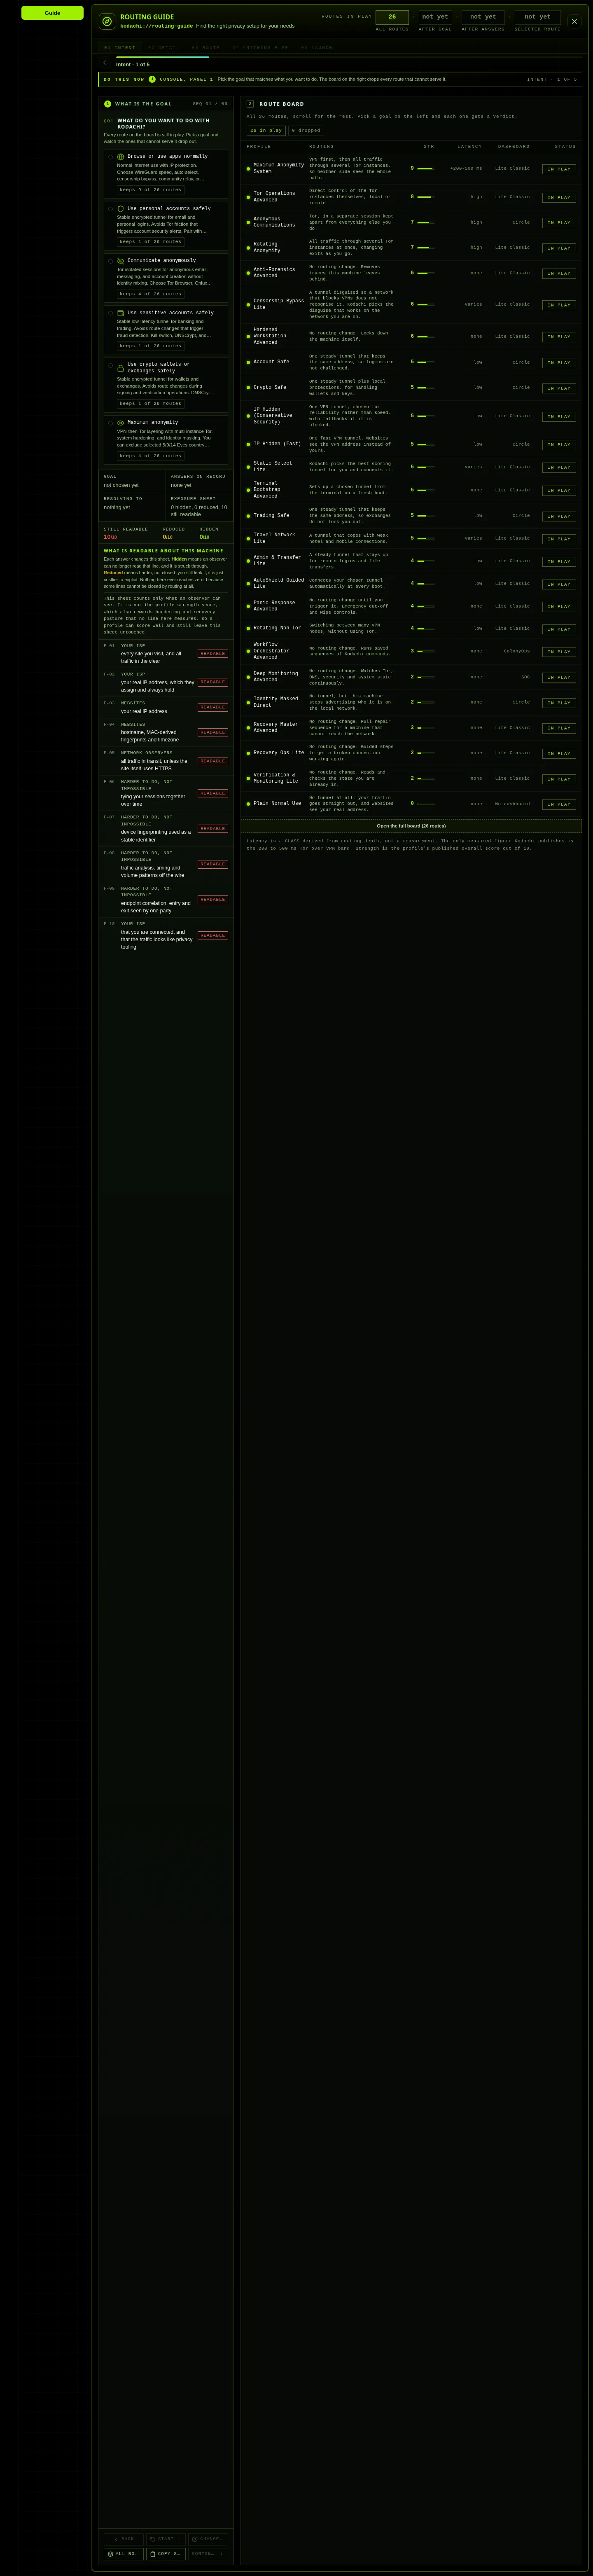
Guides and wizards
The four helpers that walk you through something instead of waiting to be operated: the Routing Guide, the Internet Recovery wizard, the guided tour every dashboard carries, and the About page.
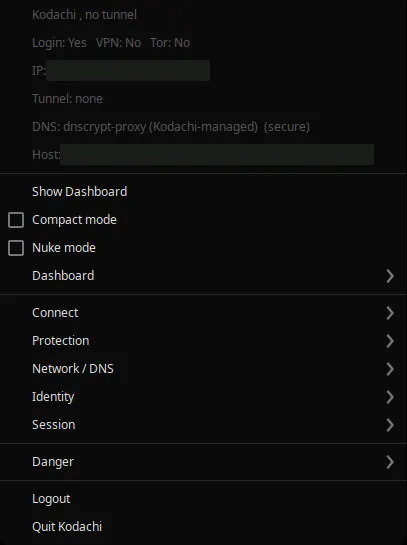
The tray menu
The system tray icon carries a second, complete set of controls: connect, torrify, rotate identity, wipe, shut down, all without opening the window.
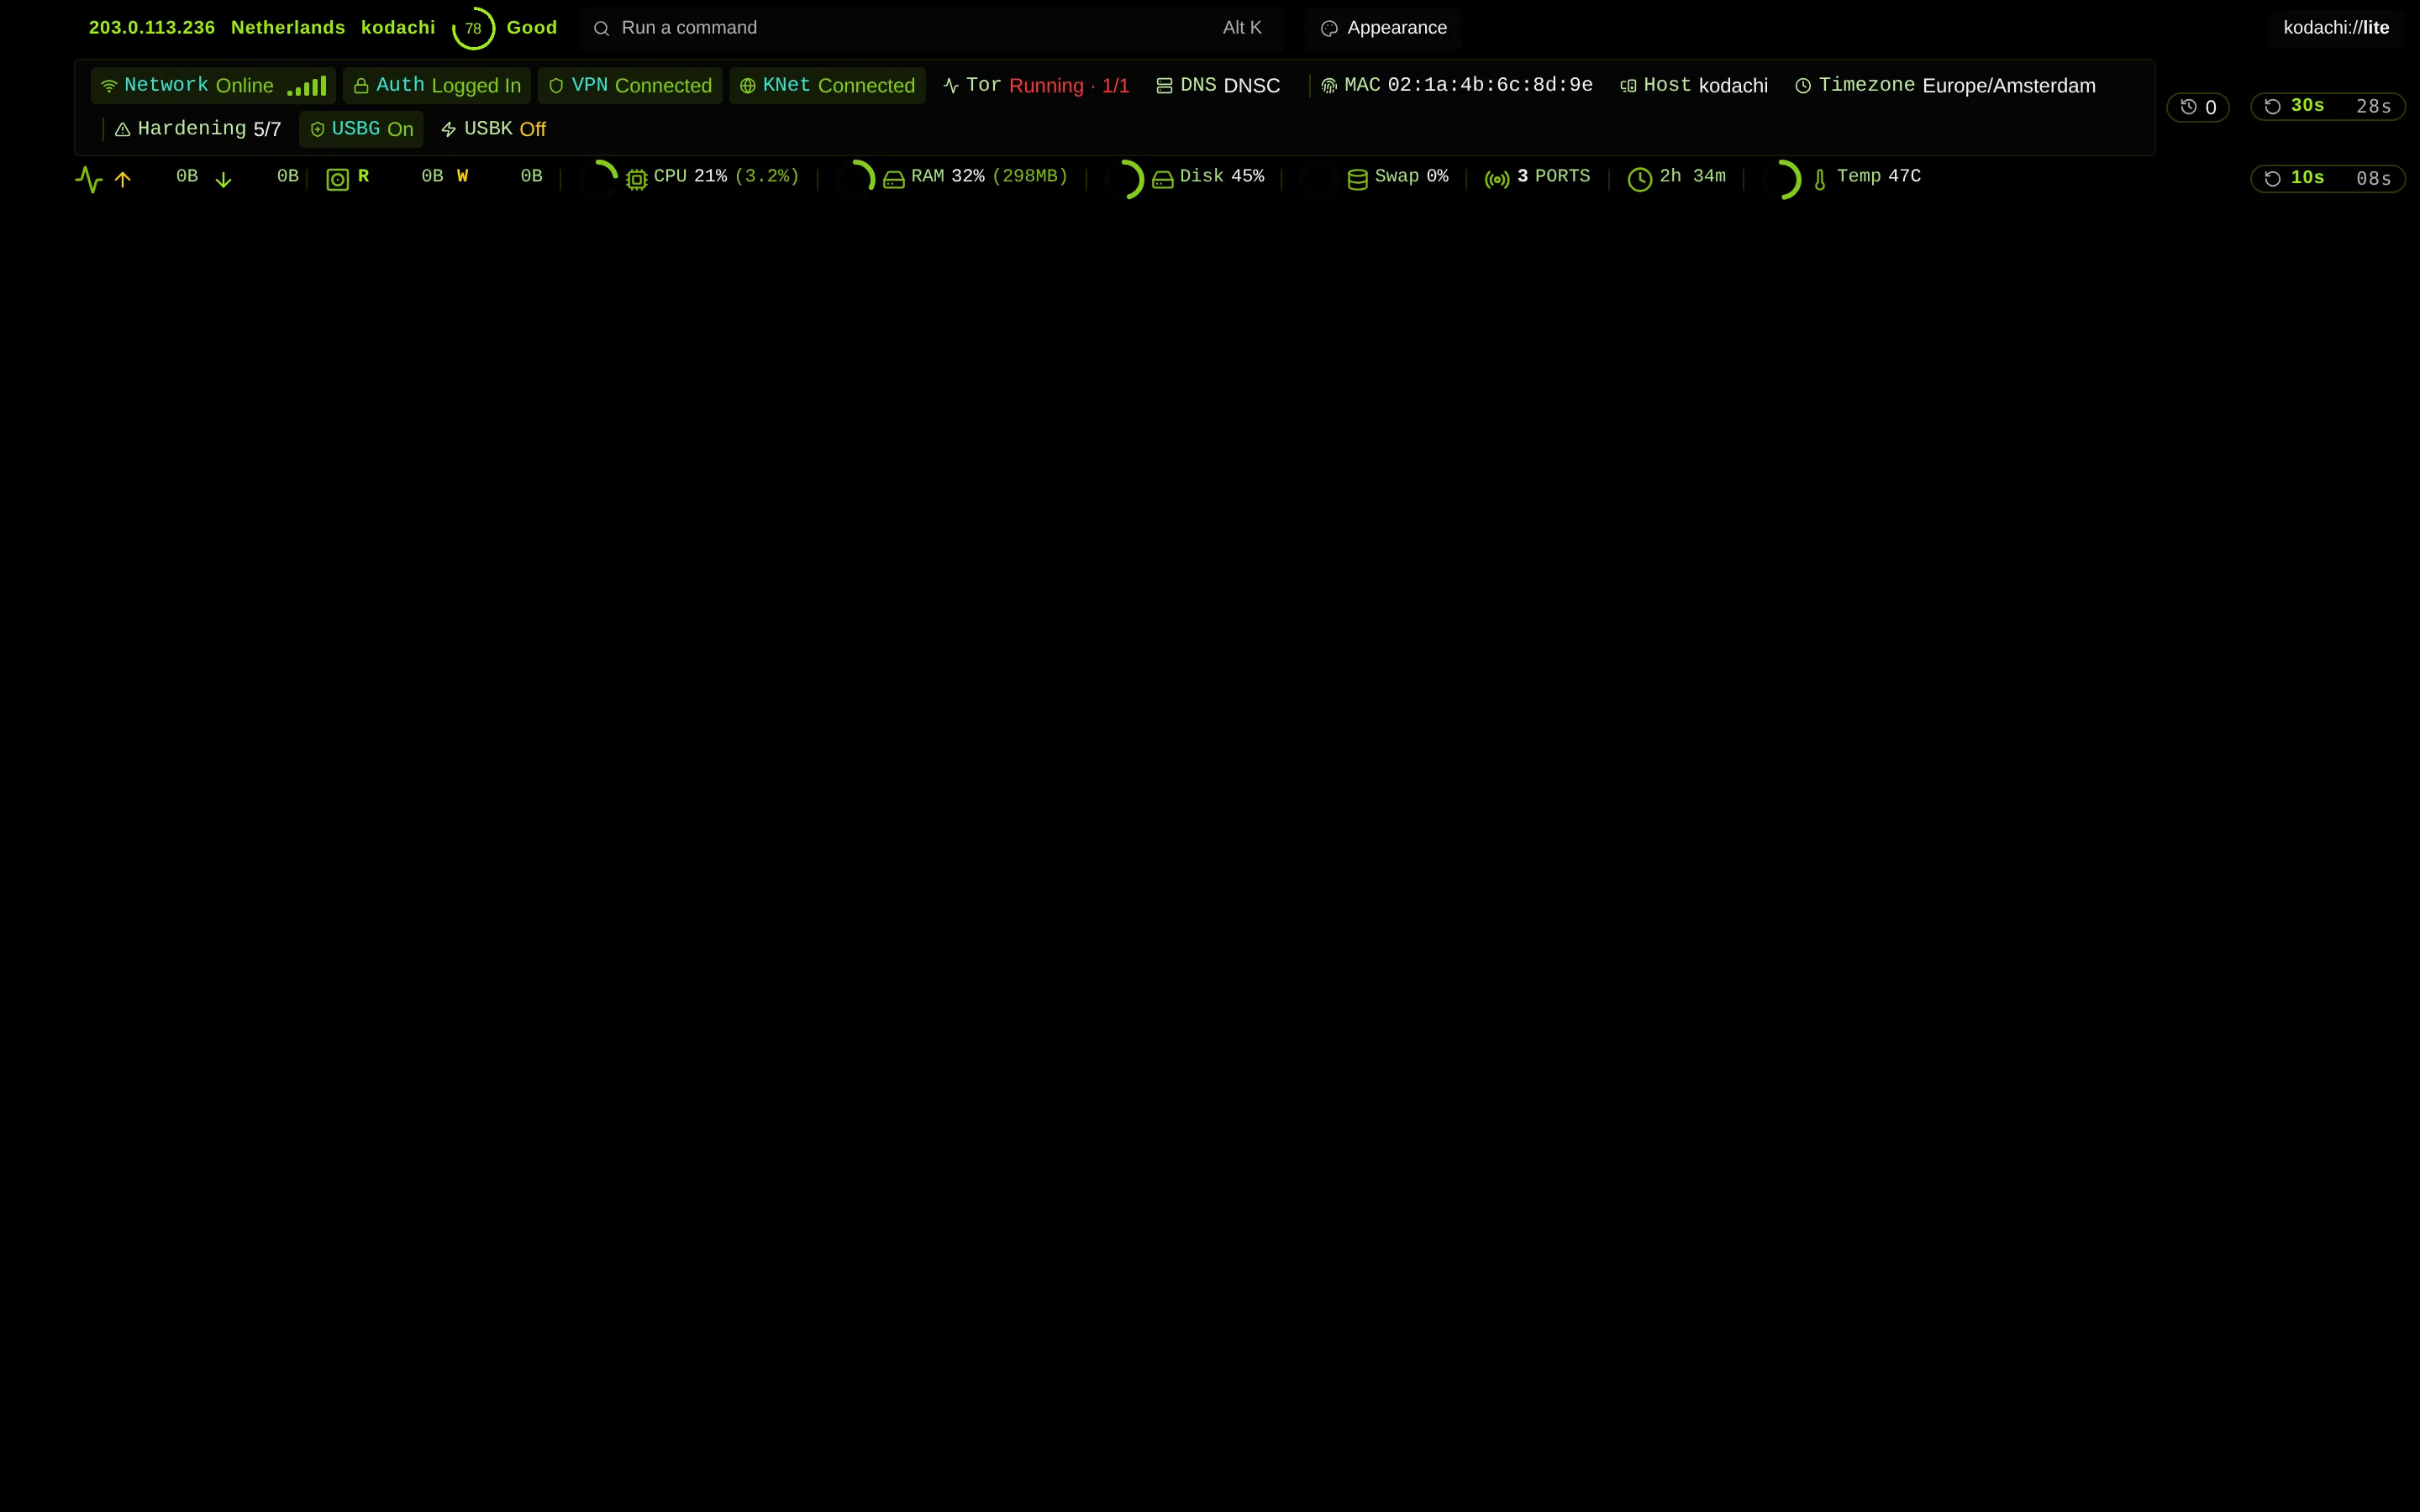
Shared controls
The chrome every dashboard carries: top bar, side rail with its Security Status card, command search, output, queue, notifications, help, About and updates.
How to read this manual: each tab plays through the dashboard chapter by chapter with the control being explained lit up on the real screen, or you click any control, chip or table row to jump straight to it. Nothing on these pages runs: they are renders of the interface plus its own explanatory text, with no dashboard logic included.
Steps against distinct controls: a control that appears on several screens, the refresh timers and the tab strip for example, is explained on each screen it appears on. That is why every page counts more walkthrough steps than distinct controls.
On the version in the screenshots: the renders carry a sample build stamp, so a version legible in a screenshot is a sample and not the release you are running. Check your build on the dashboard’s own About page.
Startup screens
Before any dashboard opens, Kodachi asks you to accept the terms, then offers a launcher. The simple picker gets you into a dashboard in one click; the advanced screen shows system readiness and every startup option first. Quick Launch also remembers a startup preference: Simple shows the dashboard cards, Advanced opens the fuller setup screen, and Direct opens the dashboard you used last without asking (if the previous start never finished, Kodachi shows the picker instead). Picking a dashboard connects no VPN and starts no Tor routing. While the launcher is on screen, Kodachi signs you in (automatic sign-in is on by default) and runs the startup privacy actions you have switched on: out of the box a random hostname and DNSCrypt, once after each boot (a random MAC and a random or synced timezone also run once per boot if you add them), while Restore MAC, Detorrify and Prepare Tor, if switched on, run at every start. Settings under Dashboard, Startup lists them all, and so does the Launch Settings tab of Advanced setup. On a plan that does not include Advanced setup, the Advanced launch button opens the upgrade screen instead. On the Free plan some cards carry a PREMIUM badge and an Unlock button instead of Open: Unlock opens the upgrade screen, where Continue with Free opens Lite Classic instead. Which dashboards your plan opens is shown live on the support page.
What is real on this page: every picture is the Kodachi dashboard itself, rendered by its own interface code, and every highlighted box is that control's real measured position, except SOC's twelve panel regions, which are declared by hand because its map is a single canvas with nothing inside it to measure. Explanations come from the dashboard's own tooltips, labels and help text. The Live replica is that screen’s real markup and stylesheet with every script removed, so it looks identical and cannot do anything. What is not: nothing on this page runs a command, and no dashboard logic is included. The readings are not a real machine. Every screen was rendered by the dashboard’s own interface code with no backend behind it, so the score, addresses, interfaces and process names are sample values chosen to make each panel show what it looks like when it has data. Where this manual supplied an address it used a reserved documentation range, but some sample rows carry well-known public addresses of their own, so read no address here as this machine’s. Of the 347 explanations on this page, 313 are the dashboard’s own tooltip, label or help text, 34 carried no tooltip of their own and were supplied by this manual (0 lifted from the dashboard’s own settings index and service registries, 34 written here), and 0 name the control and its screen because the dashboard gives that control no description of its own.
347 walkthrough steps covering 201 distinct controls across 10 screens of Startup screens. A control that appears on several screens, the refresh trio and the tab strip for example, is explained on each of them, which is why the two numbers differ. Keyboard: ← → step, space play or pause, k open or close the Know this card.
The 14 Know this cards on this page compare controls that look alike and are not. They open on 76 of the 347 steps. Every comparison in them is anchored to a sentence the dashboard itself ships, in its command catalog, its action catalog, its mode descriptions or its AutoShield catalog, and the build refuses to publish a card whose quoted sentence is no longer present in that source. Nothing here is a benchmark this project has run. One limit worth stating: the dashboard offers its tunnels in a dropdown and a filter row rather than as separate buttons, so of the fourteen protocols only WireGuard has controls of its own on these pages. The rest are named inside those two list controls, which is where their cards open.
AutoShield
AutoShield is the boot automation system. You choose the protection steps once, arm it, and Kodachi applies them every time it starts, in order, without you clicking anything. You reach it from the AutoShield tab of the Advanced setup screen. Arming starts a countdown; when it reaches zero the checked controls run category by category, each after the controls it depends on, and disarming stops the timer so nothing runs on its own. With the countdown at zero there is no timer: in the window it waits for you to press Run now, and at the next boot an armed AutoShield runs its steps straight away. The built-in steps are all non-destructive and boot-safe; the one open-ended step, Run Workflow Profile, runs a workflow you saved yourself, so check what that profile does before you arm it.
What is real on this page: every picture is the Kodachi dashboard itself, rendered by its own interface code, and every highlighted box is that control's real measured position, except SOC's twelve panel regions, which are declared by hand because its map is a single canvas with nothing inside it to measure. Explanations come from the dashboard's own tooltips, labels and help text. The Live replica is that screen’s real markup and stylesheet with every script removed, so it looks identical and cannot do anything. What is not: nothing on this page runs a command, and no dashboard logic is included. The readings are not a real machine. Every screen was rendered by the dashboard’s own interface code with no backend behind it, so the score, addresses, interfaces and process names are sample values chosen to make each panel show what it looks like when it has data. Where this manual supplied an address it used a reserved documentation range, but some sample rows carry well-known public addresses of their own, so read no address here as this machine’s. Of the 189 explanations on this page, 123 are the dashboard’s own tooltip, label or help text, 64 carried no tooltip of their own and were supplied by this manual (0 lifted from the dashboard’s own settings index and service registries, 64 written here), and 2 name the control and its screen because the dashboard gives that control no description of its own.
189 walkthrough steps covering 184 distinct controls across 1 screen of AutoShield. A control that appears on several screens, the refresh trio and the tab strip for example, is explained on each of them, which is why the two numbers differ. Keyboard: ← → step, space play or pause, k open or close the Know this card.
The 15 Know this cards on this page compare controls that look alike and are not. They open on 71 of the 189 steps. Every comparison in them is anchored to a sentence the dashboard itself ships, in its command catalog, its action catalog, its mode descriptions or its AutoShield catalog, and the build refuses to publish a card whose quoted sentence is no longer present in that source. Nothing here is a benchmark this project has run. One limit worth stating: the dashboard offers its tunnels in a dropdown and a filter row rather than as separate buttons, so of the fourteen protocols only WireGuard has controls of its own on these pages. The rest are named inside those two list controls, which is where their cards open.
Circle
Circle is the default dashboard on a fresh install, and the fastest visual privacy check. Seven clickable segments sit around one ring, AUTH, MAC, HOST (hostname), TZ (timezone), DNS, VPN and TOR, each a protection you can apply from the ring, with the security score, your public address with its flag and country, and the route it takes in the middle. Choose a route, press PROTECT (the button is named after the profile you pick), watch the ring fill. When you need more depth than seven segments, the mode switcher opens Lite Classic.
What is real on this page: every picture is the Kodachi dashboard itself, rendered by its own interface code, and every highlighted box is that control's real measured position, except SOC's twelve panel regions, which are declared by hand because its map is a single canvas with nothing inside it to measure. Explanations come from the dashboard's own tooltips, labels and help text. The Live replica is that screen’s real markup and stylesheet with every script removed, so it looks identical and cannot do anything. What is not: nothing on this page runs a command, and no dashboard logic is included. The readings are not a real machine. Every screen was rendered by the dashboard’s own interface code with no backend behind it, so the score, addresses, interfaces and process names are sample values chosen to make each panel show what it looks like when it has data. Where this manual supplied an address it used a reserved documentation range, but some sample rows carry well-known public addresses of their own, so read no address here as this machine’s. Of the 54 explanations on this page, 30 are the dashboard’s own tooltip, label or help text, 24 carried no tooltip of their own and were supplied by this manual (0 lifted from the dashboard’s own settings index and service registries, 24 written here), and 0 name the control and its screen because the dashboard gives that control no description of its own.
54 walkthrough steps covering 52 distinct controls across 2 screens of Circle. A control that appears on several screens, the refresh trio and the tab strip for example, is explained on each of them, which is why the two numbers differ. Keyboard: ← → step, space play or pause, k open or close the Know this card.
The 5 Know this cards on this page compare controls that look alike and are not. They open on 7 of the 54 steps. Every comparison in them is anchored to a sentence the dashboard itself ships, in its command catalog, its action catalog, its mode descriptions or its AutoShield catalog, and the build refuses to publish a card whose quoted sentence is no longer present in that source. Nothing here is a benchmark this project has run. One limit worth stating: the dashboard offers its tunnels in a dropdown and a filter row rather than as separate buttons, so of the fourteen protocols only WireGuard has controls of its own on these pages. The rest are named inside those two list controls, which is where their cards open.
Lite Classic and its islands
Lite Classic is the complete control workspace. Every page in it is an island: a self-contained panel with its own controls and its own live readings. This manual walks all of them, grouped the way the sidebar groups them: 16 pages in three groups, with Guide, Settings, About, Help and the notification bell at the foot of the sidebar, next to the power controls (Shutdown, plus Lock and Destroy when they are enabled). On the Free plan some pages show a lock and open the upgrade screen instead; the support page shows live which pages your plan opens. Two things a first-time user should know: Lite Classic is not the fresh-install default (Circle is), you reach it from Quick Launch or the mode switcher, and switching to it changes only the view. The dashboards are different windows onto the same machine, so opening Lite never connects a VPN or turns Tor on by itself.
What is real on this page: every picture is the Kodachi dashboard itself, rendered by its own interface code, and every highlighted box is that control's real measured position, except SOC's twelve panel regions, which are declared by hand because its map is a single canvas with nothing inside it to measure. Explanations come from the dashboard's own tooltips, labels and help text. The Live replica is that screen’s real markup and stylesheet with every script removed, so it looks identical and cannot do anything. What is not: nothing on this page runs a command, and no dashboard logic is included. The readings are not a real machine. Every screen was rendered by the dashboard’s own interface code with no backend behind it, so the score, addresses, interfaces and process names are sample values chosen to make each panel show what it looks like when it has data. Where this manual supplied an address it used a reserved documentation range, but some sample rows carry well-known public addresses of their own, so read no address here as this machine’s. Of the 5243 explanations on this page, 4313 are the dashboard’s own tooltip, label or help text, 749 carried no tooltip of their own and were supplied by this manual (106 lifted from the dashboard’s own settings index and service registries, 643 written here), and 181 name the control and its screen because the dashboard gives that control no description of its own.
5243 walkthrough steps covering 2843 distinct controls across 160 screens of Lite Classic and its islands. A control that appears on several screens, the refresh trio and the tab strip for example, is explained on each of them, which is why the two numbers differ. Keyboard: ← → step, space play or pause, k open or close the Know this card.
The 24 Know this cards on this page compare controls that look alike and are not. They open on 1188 of the 5243 steps. Every comparison in them is anchored to a sentence the dashboard itself ships, in its command catalog, its action catalog, its mode descriptions or its AutoShield catalog, and the build refuses to publish a card whose quoted sentence is no longer present in that source. Nothing here is a benchmark this project has run. One limit worth stating: the dashboard offers its tunnels in a dropdown and a filter row rather than as separate buttons, so of the fourteen protocols only WireGuard has controls of its own on these pages. The rest are named inside those two list controls, which is where their cards open.
ColonyOps
Choose ColonyOps when you want to compose, guard, simulate, replay and export multi-step security workflows on a visual operations map. Cells are single commands, colonies are ordered groups of them, and five checks run automatically as the map changes. ColonyOps is the dashboard marked Recommended in the launcher (whether your plan includes it is shown live on the support page); it is not the fresh-install default, which is Circle, and nothing placed on its map runs until you press Deploy.
What is real on this page: every picture is the Kodachi dashboard itself, rendered by its own interface code, and every highlighted box is that control's real measured position, except SOC's twelve panel regions, which are declared by hand because its map is a single canvas with nothing inside it to measure. Explanations come from the dashboard's own tooltips, labels and help text. The Live replica is that screen’s real markup and stylesheet with every script removed, so it looks identical and cannot do anything. What is not: nothing on this page runs a command, and no dashboard logic is included. The readings are not a real machine. Every screen was rendered by the dashboard’s own interface code with no backend behind it, so the score, addresses, interfaces and process names are sample values chosen to make each panel show what it looks like when it has data. Where this manual supplied an address it used a reserved documentation range, but some sample rows carry well-known public addresses of their own, so read no address here as this machine’s. Of the 102 explanations on this page, 0 are the dashboard’s own tooltip, label or help text, 102 carried no tooltip of their own and were supplied by this manual (1 lifted from the dashboard’s own settings index and service registries, 101 written here), and 0 name the control and its screen because the dashboard gives that control no description of its own.
102 walkthrough steps covering 97 distinct controls across 22 screens of ColonyOps. A control that appears on several screens, the refresh trio and the tab strip for example, is explained on each of them, which is why the two numbers differ. Keyboard: ← → step, space play or pause, k open or close the Know this card.
The 5 Know this cards on this page compare controls that look alike and are not. They open on 12 of the 102 steps. Every comparison in them is anchored to a sentence the dashboard itself ships, in its command catalog, its action catalog, its mode descriptions or its AutoShield catalog, and the build refuses to publish a card whose quoted sentence is no longer present in that source. Nothing here is a benchmark this project has run. One limit worth stating: the dashboard offers its tunnels in a dropdown and a filter row rather than as separate buttons, so of the fourteen protocols only WireGuard has controls of its own on these pages. The rest are named inside those two list controls, which is where their cards open.
SOC monitor
SOC is the live security operations monitor. It watches the machine for exposure and threats rather than operating it. The exceptions are small and each is on the bottom bar: you can start and stop the host exposure watcher, and LAN WATCH listens to the local network for a set time, sending nothing and blocking nothing. It suits a second monitor or a long watch session: the security score and the findings that produced it, ranked by severity, a live alert feed, the privacy posture column and the map. There is nothing here to configure the machine with, so a bad reading is answered on the Lite Classic or Circle pages, not here.
What is real on this page: every picture is the Kodachi dashboard itself, rendered by its own interface code, and every highlighted box is that control's real measured position, except SOC's twelve panel regions, which are declared by hand because its map is a single canvas with nothing inside it to measure. Explanations come from the dashboard's own tooltips, labels and help text. The Live replica is that screen’s real markup and stylesheet with every script removed, so it looks identical and cannot do anything. What is not: nothing on this page runs a command, and no dashboard logic is included. The readings are not a real machine. Every screen was rendered by the dashboard’s own interface code with no backend behind it, so the score, addresses, interfaces and process names are sample values chosen to make each panel show what it looks like when it has data. Where this manual supplied an address it used a reserved documentation range, but some sample rows carry well-known public addresses of their own, so read no address here as this machine’s. Of the 43 explanations on this page, 24 are the dashboard’s own tooltip, label or help text, 19 carried no tooltip of their own and were supplied by this manual (0 lifted from the dashboard’s own settings index and service registries, 19 written here), and 0 name the control and its screen because the dashboard gives that control no description of its own.
43 walkthrough steps covering 40 distinct controls across 3 screens of SOC monitor. A control that appears on several screens, the refresh trio and the tab strip for example, is explained on each of them, which is why the two numbers differ. Keyboard: ← → step, space play or pause, k open or close the Know this card.
The 2 Know this cards on this page compare controls that look alike and are not. They open on 3 of the 43 steps. Every comparison in them is anchored to a sentence the dashboard itself ships, in its command catalog, its action catalog, its mode descriptions or its AutoShield catalog, and the build refuses to publish a card whose quoted sentence is no longer present in that source. Nothing here is a benchmark this project has run. One limit worth stating: the dashboard offers its tunnels in a dropdown and a filter row rather than as separate buttons, so of the fourteen protocols only WireGuard has controls of its own on these pages. The rest are named inside those two list controls, which is where their cards open.
Vitals
Vitals is the live system monitor, laid out like a terminal dashboard. It reads the machine and shows it; it carries no routing, DNS, Tor or hardening controls. Read-only means it never changes what it monitors: the only things it ever writes are its own layout and view preferences (which panels show and in what order, which are collapsed or pinned, the watch strip, columns, density, refresh rate and whether live updates are paused), an export you ask for, and the clipboard when you copy a value.
What is real on this page: every picture is the Kodachi dashboard itself, rendered by its own interface code, and every highlighted box is that control's real measured position, except SOC's twelve panel regions, which are declared by hand because its map is a single canvas with nothing inside it to measure. Explanations come from the dashboard's own tooltips, labels and help text. The Live replica is that screen’s real markup and stylesheet with every script removed, so it looks identical and cannot do anything. What is not: nothing on this page runs a command, and no dashboard logic is included. The readings are not a real machine. Every screen was rendered by the dashboard’s own interface code with no backend behind it, so the score, addresses, interfaces and process names are sample values chosen to make each panel show what it looks like when it has data. Where this manual supplied an address it used a reserved documentation range, but some sample rows carry well-known public addresses of their own, so read no address here as this machine’s. Of the 261 explanations on this page, 126 are the dashboard’s own tooltip, label or help text, 128 carried no tooltip of their own and were supplied by this manual (0 lifted from the dashboard’s own settings index and service registries, 128 written here), and 7 name the control and its screen because the dashboard gives that control no description of its own.
261 walkthrough steps covering 256 distinct controls across 2 screens of Vitals. A control that appears on several screens, the refresh trio and the tab strip for example, is explained on each of them, which is why the two numbers differ. Keyboard: ← → step, space play or pause, k open or close the Know this card.
The 14 Know this cards on this page compare controls that look alike and are not. They open on 27 of the 261 steps. Every comparison in them is anchored to a sentence the dashboard itself ships, in its command catalog, its action catalog, its mode descriptions or its AutoShield catalog, and the build refuses to publish a card whose quoted sentence is no longer present in that source. Nothing here is a benchmark this project has run. One limit worth stating: the dashboard offers its tunnels in a dropdown and a filter row rather than as separate buttons, so of the fourteen protocols only WireGuard has controls of its own on these pages. The rest are named inside those two list controls, which is where their cards open.
Settings
Settings has six groups, in this order. Dashboard holds the preferences across seven tabs, Security protects the dashboard itself with a password, two-factor and the emergency controls, Backup is encrypted backup and restore, Tor Bridges manages censorship bypass, Services turns on the background features that stay off until you ask for them, and Display sets how the dashboard looks (interface and text size, corners, Actions layout, secondary text brightness, label font, focus outline, scrollbars and visual effects).
What is real on this page: every picture is the Kodachi dashboard itself, rendered by its own interface code, and every highlighted box is that control's real measured position, except SOC's twelve panel regions, which are declared by hand because its map is a single canvas with nothing inside it to measure. Explanations come from the dashboard's own tooltips, labels and help text. The Live replica is that screen’s real markup and stylesheet with every script removed, so it looks identical and cannot do anything. What is not: nothing on this page runs a command, and no dashboard logic is included. The readings are not a real machine. Every screen was rendered by the dashboard’s own interface code with no backend behind it, so the score, addresses, interfaces and process names are sample values chosen to make each panel show what it looks like when it has data. Where this manual supplied an address it used a reserved documentation range, but some sample rows carry well-known public addresses of their own, so read no address here as this machine’s. Of the 360 explanations on this page, 267 are the dashboard’s own tooltip, label or help text, 91 carried no tooltip of their own and were supplied by this manual (1 lifted from the dashboard’s own settings index and service registries, 90 written here), and 2 name the control and its screen because the dashboard gives that control no description of its own.
360 walkthrough steps covering 215 distinct controls across 12 screens of Settings. A control that appears on several screens, the refresh trio and the tab strip for example, is explained on each of them, which is why the two numbers differ. Keyboard: ← → step, space play or pause, k open or close the Know this card.
The 8 Know this cards on this page compare controls that look alike and are not. They open on 42 of the 360 steps. Every comparison in them is anchored to a sentence the dashboard itself ships, in its command catalog, its action catalog, its mode descriptions or its AutoShield catalog, and the build refuses to publish a card whose quoted sentence is no longer present in that source. Nothing here is a benchmark this project has run. One limit worth stating: the dashboard offers its tunnels in a dropdown and a filter row rather than as separate buttons, so of the fourteen protocols only WireGuard has controls of its own on these pages. The rest are named inside those two list controls, which is where their cards open.
Guides and wizards
Four things in the dashboard do not wait to be operated, they walk you through something. The Routing Guide asks what you are trying to do and recommends a route rather than leaving you to pick protocols; the Internet Recovery wizard checks what is broken and offers the fixes in order when the connection is down; the guided tour behind the graduation cap on every dashboard points at each control in place; and About is where the version, the licence and the project links live. This page walks each of them, stage by stage, on the real screens.
What is real on this page: every picture is the Kodachi dashboard itself, rendered by its own interface code, and every highlighted box is that control's real measured position, except SOC's twelve panel regions, which are declared by hand because its map is a single canvas with nothing inside it to measure. Explanations come from the dashboard's own tooltips, labels and help text. The Live replica is that screen’s real markup and stylesheet with every script removed, so it looks identical and cannot do anything. What is not: nothing on this page runs a command, and no dashboard logic is included. The readings are not a real machine. Every screen was rendered by the dashboard’s own interface code with no backend behind it, so the score, addresses, interfaces and process names are sample values chosen to make each panel show what it looks like when it has data. Where this manual supplied an address it used a reserved documentation range, but some sample rows carry well-known public addresses of their own, so read no address here as this machine’s. Of the 280 explanations on this page, 215 are the dashboard’s own tooltip, label or help text, 56 carried no tooltip of their own and were supplied by this manual (0 lifted from the dashboard’s own settings index and service registries, 56 written here), and 9 name the control and its screen because the dashboard gives that control no description of its own.
280 walkthrough steps covering 207 distinct controls across 15 screens of Guides and wizards. A control that appears on several screens, the refresh trio and the tab strip for example, is explained on each of them, which is why the two numbers differ. Keyboard: ← → step, space play or pause, k open or close the Know this card.
The 10 Know this cards on this page compare controls that look alike and are not. They open on 21 of the 280 steps. Every comparison in them is anchored to a sentence the dashboard itself ships, in its command catalog, its action catalog, its mode descriptions or its AutoShield catalog, and the build refuses to publish a card whose quoted sentence is no longer present in that source. Nothing here is a benchmark this project has run. One limit worth stating: the dashboard offers its tunnels in a dropdown and a filter row rather than as separate buttons, so of the fourteen protocols only WireGuard has controls of its own on these pages. The rest are named inside those two list controls, which is where their cards open.
The tray menu
Left-clicking the tray icon shows or hides the window and right-clicking it opens this menu, so for a lot of daily use this menu is the dashboard. It carries its own copy of the controls that matter, it reports the machine’s state in six readings at the top, and it can connect a tunnel, route the system through Tor, change your hardware address, wipe browser data or shut the machine down while the window is nowhere on screen.
The first six rows are readings, not controls: they are disabled by design and carry the live login, VPN, Tor, IP, tunnel, DNS and identity state so you can check the machine without opening anything. Everything below them acts.
| # | Control | What it does |
|---|---|---|
| 1 | Kodachi, checking... | The first reading. It says Kodachi followed by what is protecting you right now: VPN + Tor, VPN (Kodachi network), VPN, Tor or no tunnel. It is rewritten every ten seconds and is disabled because it is a label, not a control. |
| 2 | Login: ... VPN: ... Tor: ... | Login, VPN and Tor state on one line. Disabled: it reports, it does not act. |
| 3 | IP: checking... | Your public address as the last probe saw it. Disabled: a reading. |
| 4 | Tunnel: checking... | Which tunnel is up, if any, and through what. Disabled: a reading. |
| 5 | DNS: checking... | Which resolver is answering and whether it is encrypted. Disabled: a reading. |
| 6 | Host: ... MAC: ... TZ: ... | Host name, hardware address and timezone as the machine currently presents them. Disabled: a reading. |
| 8 | Show Dashboard | Brings the window back and focuses it. A left click on the tray icon also shows a hidden window, and hides a shown one. |
| 9 | Compact mode | Shrinks the window to its compact layout, or restores the full one. |
| 10 | Nuke mode | Shrinks the window to a small panel with the Destroy button, a button that opens its options in Settings, an Always-on-top toggle, and a button that leaves the panel, because the window has no title bar in this mode. The dashboard's panels are hidden, not changed, and come back exactly as they were when you leave it or choose this row again. |
| 11 | Dashboardsubmenu | Opens the Dashboard group: 4 rows, further down this page. |
| 13 | Connectsubmenu | Opens the Connect group: 16 rows, further down this page. |
| 14 | Protectionsubmenu | Opens the Protection group: 8 rows, further down this page. |
| 15 | Network / DNSsubmenu | Opens the Network / DNS group: 11 rows, further down this page. |
| 16 | Identitysubmenu | Opens the Identity group: 8 rows, further down this page. |
| 17 | Sessionsubmenu | Opens the Session group: 3 rows, further down this page. |
| 19 | Dangersubmenu | Opens the Danger group: 5 rows, further down this page. |
| 21 | Login | Signs you in with the account saved on this machine and keeps the session alive by signing in again automatically when it expires. Once you are signed in the row reads Logout and clicking it ends the session. Nothing in this menu is hidden while you are signed out, but about forty rows run a command that refuses without a session, so they fail quietly until you sign in here or in the window. runs online-auth authenticate --relogin, or online-auth logout when signed in |
| 22 | Quit Kodachi | Quits the dashboard. Any tunnel, Tor routing and DNS (Domain Name System) setting the background services hold stays exactly as it is. The only things that stop are the WatchGuard watchers the dashboard itself started, and their saved state is cleared so the next start begins clean. |
The tick boxes are readings, not switches you set. A tick next to VPN, Tor or a protocol means a probe found it on. Clicking one asks for the change; the tick moves when the machine answers, not when you click.
An ellipsis means a confirmation follows. Every row in the Danger group ends in one, so do the identity rows that force a change, and so does Restore Default DNS in the Network group. Nine rows confirm in all; none of them acts on the click alone.
Nine of these rows finish in the window. They open a confirmation there rather than acting from the menu, so the tray will bring the window forward for those even though it hid it a moment ago.